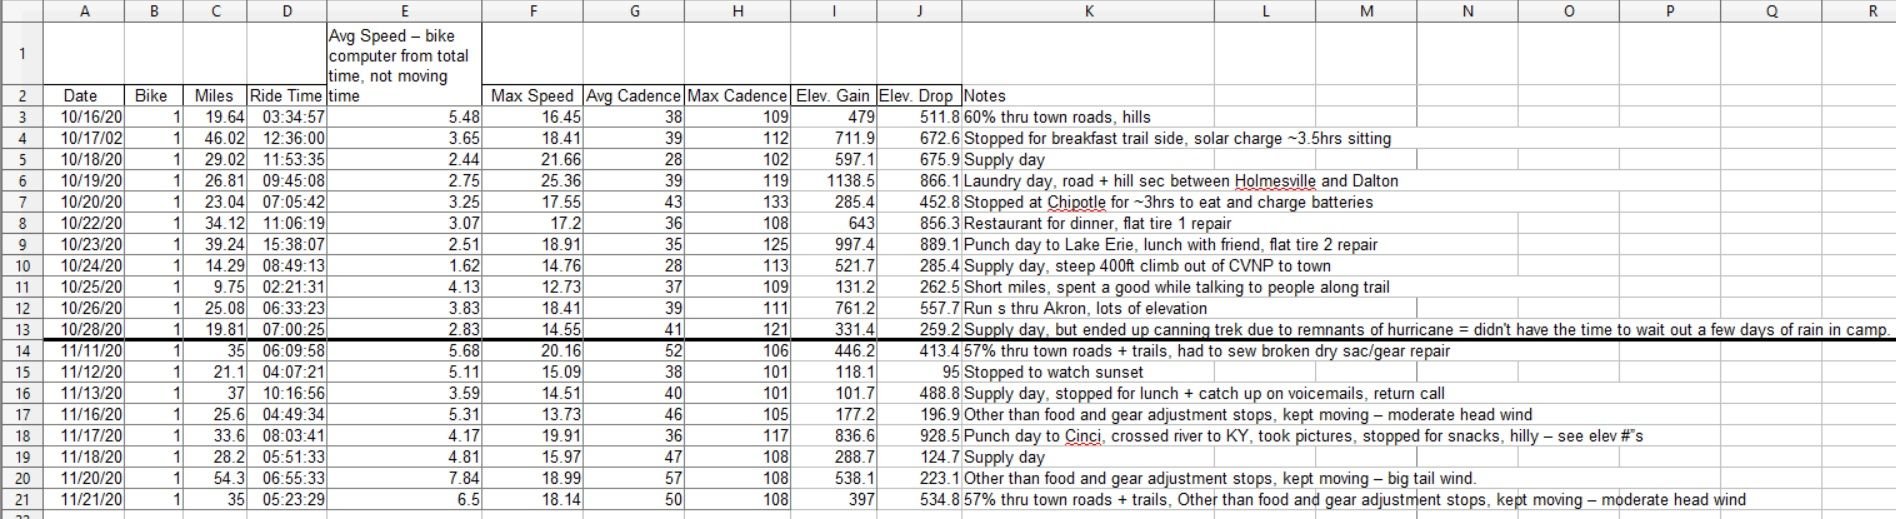
I am compiling data here. I input all my ride data yesterday to my chart for the 2nd leg of the trip. Looking at it here it is interesting to compare days vs distance vs avg speed/daily pace vs. what I did those days. Below is the chart for reference. Of note - the avg speed column, as noted, is based on the recording time of the day. This means - from the second I start recording a daily trip when I leave camp until I shut down for camp. On some days larger meals - breakfast and dinner, for example - are included in that time because I did not eat where I camped. Therefore there was moving time between camp and eating/eating and camp = that meal time is included in the averaging of the pace for that day, whereas when meals are included in my camp time that is not included in the recording as I have either already ended or have not started the recording for the day (still in camp, or have already arrived in camp).
The thick line is the separation between the northern/1st leg and the southern/2nd leg treks.
If I have a full day of riding - meaning an early start and good mileage - even with stops a 4mph or better daily pace is a good number for planning purposes. You can't bank timing of getting to a destination off of a "moving average" because you aren't moving all the time - at least I am not. If you can figure out how to eat (possibly cook), drink, and go to the bathroom, at least, if not fix gear and adjust your load while moving also then maybe a moving average can start to approach your daily pace and you can more accurately use it to predict timing to a destination. Otherwise, all of the fore-mentioned will pull away from your moving average.
Case-in-point - line item 21. I used a 4mph average to plan that day and my "get up" time. I had set the mileage to 37. So 37/4 = 9.25 hours. If you look at the chart - I made the run in 5hrs 23min. So I shaved close to 4 hours off with the 6.5mph average - 2.5mph faster average and a couple miles shy of my estimate. If I had a stiffer head wind and had more slow-downs through town that would have quickly filled in that 4hr window.
On the other hand, look at line item 20. That was over 50 miles with few stops - but I did stop. By taking out a supply run and trimming the stops to just the essentials, even with a heavy tail wind, my daily pace was nearly 8mph. That is still way under a "moving average" - but it is the highest daily pace of any day in either of the legs of the trip. Line item 17 was similar trail to where I had the head wind on in line item 20 - going the opposite direction with a head wind. That made over a 2mph difference in my daily pace with the same type of daily activities - just essential stops. Over the course of, say, 5 hours that 2mph difference in pace is a 10 mile penalty. Or, for the same extra 10 miles that is a 5 hour penalty on the clock.
If you take the line item 20 distance and put it against the line item 17 pace - that would take the 6hrs 55min up to about 10hrs 15min - over another 3 hours. That's 3+ hours difference, essentially, due to weather. This estimate doesn't account for the extra energy being spent fighting the wind, either - just the slow down. I know me - I know I wouldn't be able to do that in 1 day. I wouldn't hold up that long/hard. That's something to think about in trip planning...
It is interesting to see the numbers and think through the trip looking back on it. Good stuff.
Addition - line item 10 on leg 1/northern = that was one of the few days I had decent sun. I camped near the canal visitor center on the N tip of the CVNP - which was one of the few(!!) places on the whole trip that had running water that was still on (not shut off due to covid). I knew that from my trip up so staying close was the best plan. I stayed at that park for 3.5 hours cooking breakfast, soaking up sun with the solar panels (and myself... it was quite nice), and yaking with people. So that factors heavily in to the daily pace - not just the climb getting to town with the resupply run as noted.
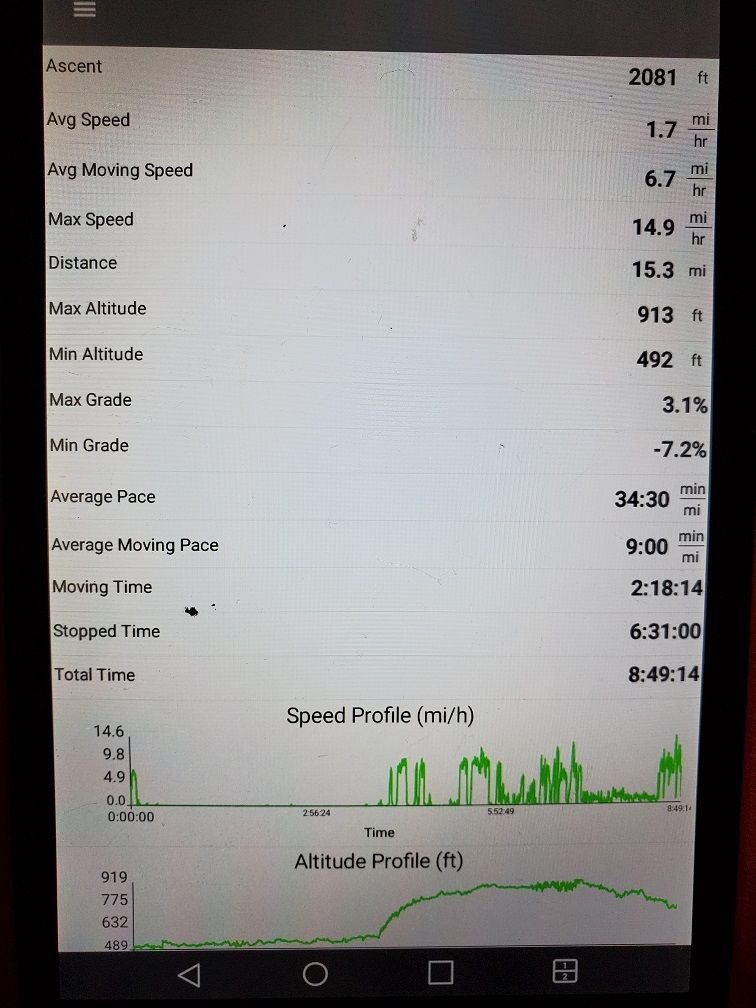
Also for what it is worth - I run a tablet with an app called GaiaGPS for my trip recording. This breaks down moving vs all up speed averages. The trip stats for line item 10 have a moving average (as opposed to the all up shown) is 6.7mph. I am actually shocked the speed is that high given the day. See data below and note the profile graphs towards the bottom: