


Q? for strong racers
 01-29-19, 12:17 AM
#26
Senior Member
Join Date: Jan 2014
Location: Southern California, USA
Posts: 10,475
Bikes: 1979 Raleigh Team 753
Mentioned: 153 Post(s)
Tagged: 0 Thread(s)
Quoted: 3374 Post(s)
Liked 371 Times
in
253 Posts
I have read, generally accepted and consistently for years, that in the upper reaches of cycling performance, and even merely strong racers, the differences get tight. Every minor edge is worth pursuing because one competitor is close to the next. I have generally accepted that, as practically self-evident. And, people who race confirm that so I tend not to question it.
But I've started to wonder if that might only be true for a handful of world-class elite, and maybe even the opposite really pertains. It there a table of performance vs percentile anywhere, that supports the consensus above? I look at the famous Coggan chart for example, and it looks like the difference in performance increases for each percentile tranche, not decreases.
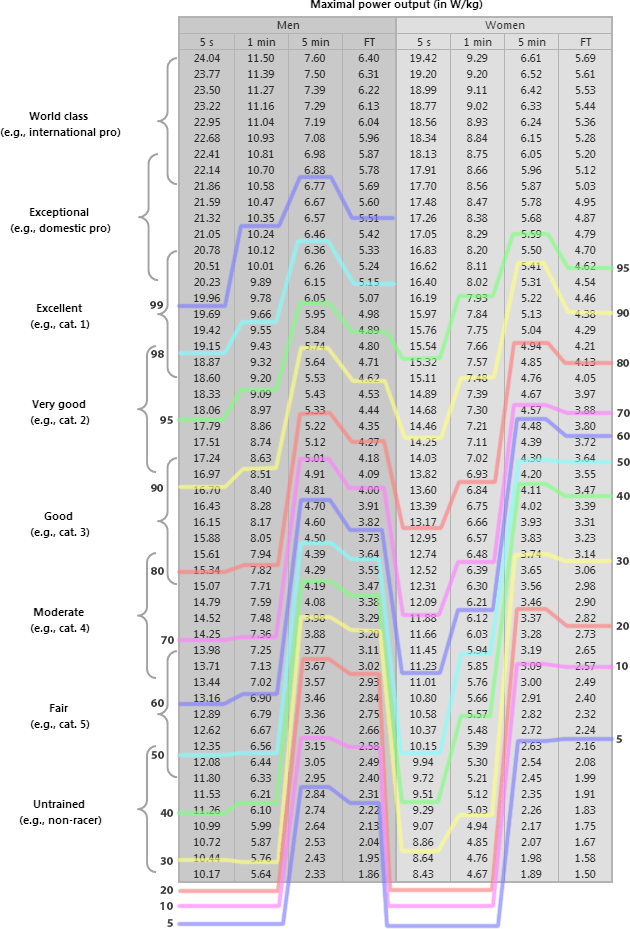
Cyclinganalytics.com
The percentile tranches are from reported values by CyclingAnalytics site members. I arranged the "FT" column into a scatter plot:
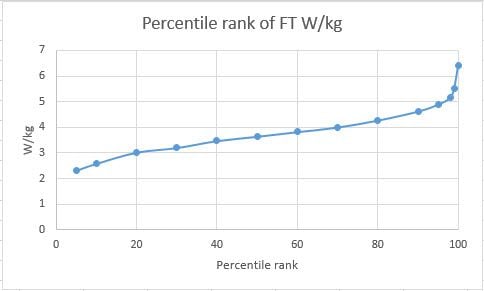
And it looks to me like the high end shows a drastic increase in performance for a given percentile difference. If the difference between top competitors really get smaller, that line should be flatter not steeper.
I saw a similar situation from running statistics, which is what prompted this. The X-axis is reversed from the above chart: Percentage of "faster than runner" rather than percentage of "runner is faster than":
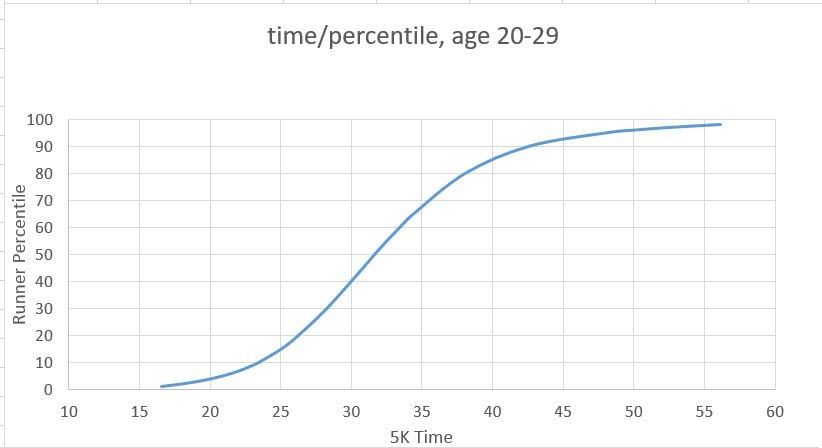
My suspicion is that this reflects the general situation. Is there some data that sheds more light on this? Are there some special factors or confounding variables that invalidate it, or is our general assumption in fact wrong? What do you think?
But I've started to wonder if that might only be true for a handful of world-class elite, and maybe even the opposite really pertains. It there a table of performance vs percentile anywhere, that supports the consensus above? I look at the famous Coggan chart for example, and it looks like the difference in performance increases for each percentile tranche, not decreases.
Cyclinganalytics.com
The percentile tranches are from reported values by CyclingAnalytics site members. I arranged the "FT" column into a scatter plot:
And it looks to me like the high end shows a drastic increase in performance for a given percentile difference. If the difference between top competitors really get smaller, that line should be flatter not steeper.
I saw a similar situation from running statistics, which is what prompted this. The X-axis is reversed from the above chart: Percentage of "faster than runner" rather than percentage of "runner is faster than":
My suspicion is that this reflects the general situation. Is there some data that sheds more light on this? Are there some special factors or confounding variables that invalidate it, or is our general assumption in fact wrong? What do you think?
 01-29-19, 07:00 AM
#27
Blast from the Past

Isn't the W/kg curve you are presenting for cycling a physiological marker vs the running curve being a performance one? Not sure what data is available but wouldn't a better comparison be the spread in TT times or IP times at various levels? Interesting subject.
Last edited by Voodoo76; 01-29-19 at 07:34 AM.
01-29-19, 08:46 AM
#28
Senior Member
Thread Starter

Join Date: Apr 2011
Location: Alpharetta, GA
Posts: 15,280
Bikes: Nashbar Road
Mentioned: 71 Post(s)
Tagged: 0 Thread(s)
Quoted: 2934 Post(s)
Liked 341 Times
in
228 Posts
Individual time trial times would be useful, if we had all of them for a large number of races. Surely someone has compiled it, somewhere.
01-29-19, 09:35 AM
#29
~>~
01-29-19, 10:35 AM
#30
Senior Member
Thread Starter
Join Date: Apr 2011
Location: Alpharetta, GA
Posts: 15,280
Bikes: Nashbar Road
Mentioned: 71 Post(s)
Tagged: 0 Thread(s)
Quoted: 2934 Post(s)
Liked 341 Times
in
228 Posts
01-29-19, 12:00 PM
#31
~>~
The Medium Gear TT folk have been at this highly limited TT thing for a very long time and might be willing to provide the full data for years, or not.
Failing that an inquiry of the same to the UCI which (supposedly) has all TT finishing data might be provided to a qualified researcher, or not.
-Bandera
01-29-19, 03:29 PM
#32
neo-poster

Join Date: Mar 2016
Location: the Ozarks
Posts: 48
Bikes: 2018 Specialized Allez Sprint, 2018 Specialized Tarmac SL6 Pro; Cannondale Slice RS
Mentioned: 0 Post(s)
Tagged: 0 Thread(s)
Quoted: 23 Post(s)
Likes: 0
Liked 2 Times
in
1 Post
Also, I wonder if you're maybe thinking about it wrong. Percentage of riders with a higher than 6 W/kg is going to be pretty small, but they exist. So unless you're heavily rounding or only looking at 95th percentile, you're still going to have that final spike in the graph, even if it really only represents 0.25% of the sample.
I think the plot you listed in misleading. Try it as a bell curve. You'll see that after 5 W/kg or so, the line is essentially flat and only 30% of the sample is over the 4 W/kg mark. According to the chart, 4 W/kg is what's needed to be an entry Cat 2.
So ignoring my comment about the chart being skewed high, you can conclude that adding 0.25 W/kg to your FT jumps over less and less riders as you reach 100%.
Sidenote: I tend to think of W/kg as a pseudo logarithmic scale in terms of difficulty to achieve. 3 is relatively easy to achieve and maintain with casual training/riding. 4 much less so. 5 puts you in pro ranks, 6 puts your in WT Pro ranks.
But yeah, if plotted differently, this chart would more-or-less look like a bell curve. To explain the reasoning behind the general idea of the top riders being closer, think about it this way. On a given day in July you have nearly all of the handful of "world class" riders racing against each other in one race in France. Meanwhile in my local P/1/2 crit I'm racing against people who range from "very good" to exceptional. And while there are thousands of other cyclists whose FTPs are also around the 5.0 mark give or take a few tenths, some are racing in Cali, some in the Pacific Northwest, some in the Midwest, some in New England, many throughout Europe and Asia, a few in Africa, and a some in Australia zwifting during the winter months.
You can see the same trend in many sports. As the level of competition increases, you go from a very local scale with large differences in ability to a global scale with very fine differences in ability.
01-29-19, 04:58 PM
#33
Senior Member
Thread Starter
Join Date: Apr 2011
Location: Alpharetta, GA
Posts: 15,280
Bikes: Nashbar Road
Mentioned: 71 Post(s)
Tagged: 0 Thread(s)
Quoted: 2934 Post(s)
Liked 341 Times
in
228 Posts
I wish lol.
But yeah, if plotted differently, this chart would more-or-less look like a bell curve. To explain the reasoning behind the general idea of the top riders being closer, think about it this way. On a given day in July you have nearly all of the handful of "world class" riders racing against each other in one race in France. Meanwhile in my local P/1/2 crit I'm racing against people who range from "very good" to exceptional. And while there are thousands of other cyclists whose FTPs are also around the 5.0 mark give or take a few tenths, some are racing in Cali, some in the Pacific Northwest, some in the Midwest, some in New England, many throughout Europe and Asia, a few in Africa, and a some in Australia zwifting during the winter months.
You can see the same trend in many sports. As the level of competition increases, you go from a very local scale with large differences in ability to a global scale with very fine differences in ability.
In other words, you'd be saying that two riders at 99.95% and 99.96% are closer together than two at 99.5% and 99.6%. Sure, but I say the first two are MORE apart than 1/10th (because 1/10th the domain) the amount that the second two are. Concave up graph, all the way to the end.
01-29-19, 07:43 PM
#35
Senior Member
Join Date: Nov 2015
Location: Music City, USA
Posts: 4,444
Bikes: bikes
Mentioned: 52 Post(s)
Tagged: 0 Thread(s)
Quoted: 2622 Post(s)
Liked 1,429 Times
in
711 Posts
Absolutely.
But if you have the science, too, you can make some wondrous works of art.
I was looking at Egan Bernal's strava the other day. Two or so years ago, before he became world famous, he did 7.3 w/kg for 18 minutes to win a race in Colombia.
7.3 w/kg. After four hours of racing already. At altitude. Oh my god. That's genuinely something I can't do for even three minutes. I don't even know how to comprehend that.
01-29-19, 07:48 PM
#36
Senior Member
Join Date: Nov 2015
Location: Music City, USA
Posts: 4,444
Bikes: bikes
Mentioned: 52 Post(s)
Tagged: 0 Thread(s)
Quoted: 2622 Post(s)
Liked 1,429 Times
in
711 Posts
Yeah. You can through Strava for some people. Nathan Brown has some outright ungodly numbers from the TdF last year or the year before when he got the Polka Dot jersey for a day. Kwiat's world champs victory is on there. Hayman's Paris Roubaix victory. Egan Bernal has a lot of other-worldly data before Sky. There's also lots of Milan San Remo stuff, and lots of "regular" riders posting stuff from races all throughout the year. You can suss out a ton of numbers. And those numbers are hard to fathom.
01-30-19, 12:54 PM
#38
�\_(ツ)_/�

Join Date: Jun 2008
Location: Redwood City, CA
Posts: 10,978
Bikes: aggressive agreement is what I ride.
Mentioned: 109 Post(s)
Tagged: 0 Thread(s)
Quoted: 967 Post(s)
Likes: 0
Liked 4 Times
in
4 Posts
Absolutely.
But if you have the science, too, you can make some wondrous works of art.
I was looking at Egan Bernal's strava the other day. Two or so years ago, before he became world famous, he did 7.3 w/kg for 18 minutes to win a race in Colombia.
7.3 w/kg. After four hours of racing already. At altitude. Oh my god. That's genuinely something I can't do for even three minutes. I don't even know how to comprehend that.
But if you have the science, too, you can make some wondrous works of art.
I was looking at Egan Bernal's strava the other day. Two or so years ago, before he became world famous, he did 7.3 w/kg for 18 minutes to win a race in Colombia.
7.3 w/kg. After four hours of racing already. At altitude. Oh my god. That's genuinely something I can't do for even three minutes. I don't even know how to comprehend that.
01-30-19, 03:42 PM
#39
Senior Member
Join Date: Nov 2015
Location: Music City, USA
Posts: 4,444
Bikes: bikes
Mentioned: 52 Post(s)
Tagged: 0 Thread(s)
Quoted: 2622 Post(s)
Liked 1,429 Times
in
711 Posts
Stage race in France. So not at altitude, but still after four hours of racing. Stage race. Yikes.
02-01-19, 02:32 PM
#40
�\_(ツ)_/�
Join Date: Jun 2008
Location: Redwood City, CA
Posts: 10,978
Bikes: aggressive agreement is what I ride.
Mentioned: 109 Post(s)
Tagged: 0 Thread(s)
Quoted: 967 Post(s)
Likes: 0
Liked 4 Times
in
4 Posts
https://www.strava.com/activities/1039584035
Stage race in France. So not at altitude, but still after four hours of racing. Stage race. Yikes.
Stage race in France. So not at altitude, but still after four hours of racing. Stage race. Yikes.
02-01-19, 04:18 PM
#41
Senior Member
Thread Starter
Join Date: Apr 2011
Location: Alpharetta, GA
Posts: 15,280
Bikes: Nashbar Road
Mentioned: 71 Post(s)
Tagged: 0 Thread(s)
Quoted: 2934 Post(s)
Liked 341 Times
in
228 Posts
"Strong racers" - I was thinking Category 1, or Cat 3, or basically anyone who races any category with a chance to podium. But if one of those Bernal-type racers chimed in here they would probably know better than the rest of us.
02-12-19, 04:46 PM
#42
Senior Member

Join Date: Jul 2002
Location: Sacramento, California, USA
Posts: 40,865
Bikes: Specialized Tarmac, Canyon Exceed, Specialized Transition, Ellsworth Roots, Ridley Excalibur
Mentioned: 68 Post(s)
Tagged: 0 Thread(s)
Quoted: 2952 Post(s)
Liked 3,106 Times
in
1,417 Posts
Absolutely.
But if you have the science, too, you can make some wondrous works of art.
I was looking at Egan Bernal's strava the other day. Two or so years ago, before he became world famous, he did 7.3 w/kg for 18 minutes to win a race in Colombia.
7.3 w/kg. After four hours of racing already. At altitude. Oh my god. That's genuinely something I can't do for even three minutes. I don't even know how to comprehend that.
But if you have the science, too, you can make some wondrous works of art.
I was looking at Egan Bernal's strava the other day. Two or so years ago, before he became world famous, he did 7.3 w/kg for 18 minutes to win a race in Colombia.
7.3 w/kg. After four hours of racing already. At altitude. Oh my god. That's genuinely something I can't do for even three minutes. I don't even know how to comprehend that.

Thread
Thread Starter
Forum
Replies
Last Post
The Octopus
Long Distance Competition/Ultracycling, Randonneuring and Endurance Cycling
28
03-21-12 03:38 PM
