


Strava "average speed" inconsistencies
 10-25-21, 09:31 AM
#1
Senior Member
Thread Starter
Join Date: Aug 2009
Location: Minneapolis
Posts: 5,783
Bikes: 2022 Salsa Beargrease Carbon Deore 11, 2020 Salsa Warbird GRX 600, 2020 Canyon Ultimate CF SLX disc 9.0 Di2, 2020 Catrike Eola, 2016 Masi cxgr, 2011, Felt F3 Ltd, 2010 Trek 2.1, 2009 KHS Flite 220
Mentioned: 20 Post(s)
Tagged: 0 Thread(s)
Quoted: 4422 Post(s)
Liked 3,049 Times
in
1,888 Posts
Strava "average speed" inconsistencies
Maybe this has been covered before, but does anybody know how Strava calculates average speed in its different displays? The topline value seems to be consistently a little lower than the summary value displayed in the "Analysis" feature, and also lower than what my Wahoo will show at the end of a ride.
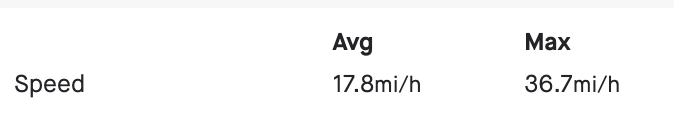
For example, this is the summary value for a recent ride: 17.9 MPH:
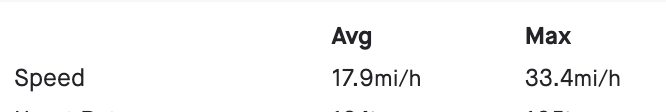
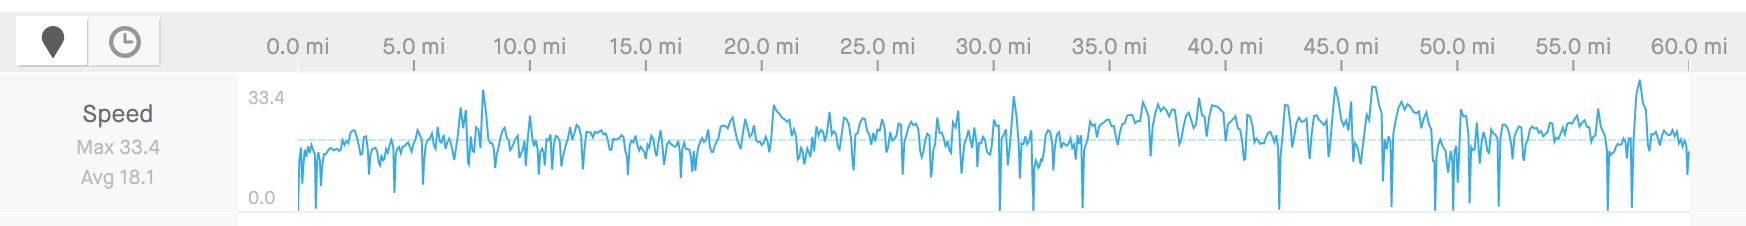
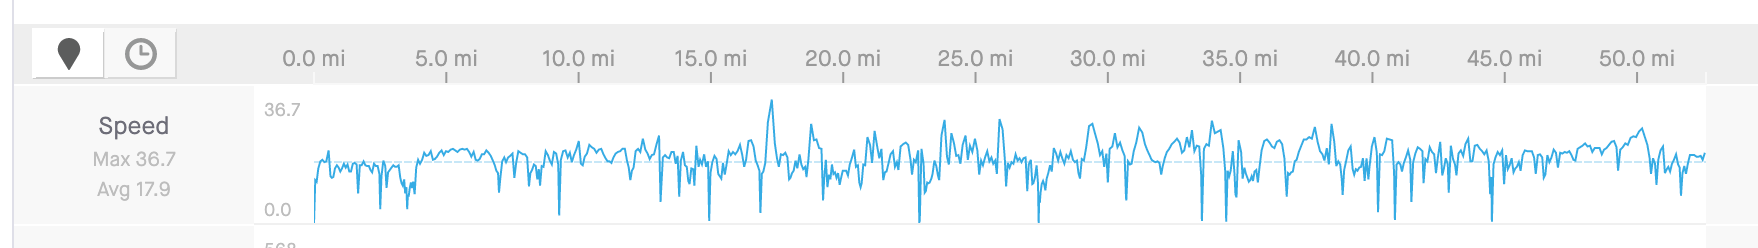
While the Analysis shows 18.1 MPH average:
This difference happens consistently on most all rides.
It's in the noise, I know, but the offset is systematic (always lower in the topline value), and I'm just wondering if anybody knows why this happens.
For example, this is the summary value for a recent ride: 17.9 MPH:
While the Analysis shows 18.1 MPH average:
This difference happens consistently on most all rides.
It's in the noise, I know, but the offset is systematic (always lower in the topline value), and I'm just wondering if anybody knows why this happens.
 10-25-21, 09:35 AM
#2
Senior Member
Thread Starter
Join Date: Aug 2009
Location: Minneapolis
Posts: 5,783
Bikes: 2022 Salsa Beargrease Carbon Deore 11, 2020 Salsa Warbird GRX 600, 2020 Canyon Ultimate CF SLX disc 9.0 Di2, 2020 Catrike Eola, 2016 Masi cxgr, 2011, Felt F3 Ltd, 2010 Trek 2.1, 2009 KHS Flite 220
Mentioned: 20 Post(s)
Tagged: 0 Thread(s)
Quoted: 4422 Post(s)
Liked 3,049 Times
in
1,888 Posts
(I'm not asking why the Wahoo and Strava might be different - different processing of the raw gps data can definitely lead to small differences in averages- particularly in how the different algorithms process the time below the threshold speed (2 mph, 4 mph, etc.). But it seems that Strava itself is processing the same data differently for the two average speed calculations?)
10-25-21, 10:15 AM
#3

I'm good to go!
Join Date: Jul 2017
Location: Mississippi
Posts: 15,133
Bikes: Tarmac Disc Comp Di2 - 2020
Mentioned: 51 Post(s)
Tagged: 0 Thread(s)
Quoted: 6278 Post(s)
Liked 4,864 Times
in
3,353 Posts
Maybe/probably the average gets calculated for each page. And maybe the way they derive other data for that page affects what they show for an average.
I don't remember if the totals accumulated on the device are actually transferred in the data file. But also they might be sometimes using that value or basing their calculation on a device accumulated total that might well be different from the summed up GPS position data and timestamps in the file.
I don't remember if the totals accumulated on the device are actually transferred in the data file. But also they might be sometimes using that value or basing their calculation on a device accumulated total that might well be different from the summed up GPS position data and timestamps in the file.
 10-25-21, 10:31 AM
#4
Thread Killer
Join Date: Aug 2008
Location: Ann Arbor, MI
Posts: 12,484
Bikes: 15 Kinesis Racelight 4S, 76 Motebecane Gran Jubil�e, 17 Dedacciai Gladiatore2, 12 Breezer Venturi, 09 Dahon Mariner, 12 Mercier Nano, 95 DeKerf Team SL, 19 Tern Rally, 21 Breezer Doppler Cafe+, 19 T-Lab X3, 91 Serotta CII, 23 3T Strada
Mentioned: 30 Post(s)
Tagged: 0 Thread(s)
Quoted: 3195 Post(s)
Liked 1,731 Times
in
1,047 Posts
I’ve noticed the variation at times as well, however, looking back at recent rides, it is not consistent, and sometimes (usually, at least recently) the two averages (in Overview and Analysis tabs) match.
10-25-21, 11:02 AM
#5
Senior Member
Thread Starter
Join Date: Aug 2009
Location: Minneapolis
Posts: 5,783
Bikes: 2022 Salsa Beargrease Carbon Deore 11, 2020 Salsa Warbird GRX 600, 2020 Canyon Ultimate CF SLX disc 9.0 Di2, 2020 Catrike Eola, 2016 Masi cxgr, 2011, Felt F3 Ltd, 2010 Trek 2.1, 2009 KHS Flite 220
Mentioned: 20 Post(s)
Tagged: 0 Thread(s)
Quoted: 4422 Post(s)
Liked 3,049 Times
in
1,888 Posts
The effect might be device dependent.
Oh yeah, and Zwift "speeds" are pretty much meaningless to begin with.
Last edited by MinnMan; 10-25-21 at 11:06 AM.
10-25-21, 11:05 AM
#6
Senior Member
Thread Starter
Join Date: Aug 2009
Location: Minneapolis
Posts: 5,783
Bikes: 2022 Salsa Beargrease Carbon Deore 11, 2020 Salsa Warbird GRX 600, 2020 Canyon Ultimate CF SLX disc 9.0 Di2, 2020 Catrike Eola, 2016 Masi cxgr, 2011, Felt F3 Ltd, 2010 Trek 2.1, 2009 KHS Flite 220
Mentioned: 20 Post(s)
Tagged: 0 Thread(s)
Quoted: 4422 Post(s)
Liked 3,049 Times
in
1,888 Posts
Maybe/probably the average gets calculated for each page. And maybe the way they derive other data for that page affects what they show for an average.
I don't remember if the totals accumulated on the device are actually transferred in the data file. But also they might be sometimes using that value or basing their calculation on a device accumulated total that might well be different from the summed up GPS position data and timestamps in the file.
I don't remember if the totals accumulated on the device are actually transferred in the data file. But also they might be sometimes using that value or basing their calculation on a device accumulated total that might well be different from the summed up GPS position data and timestamps in the file.
10-25-21, 11:11 AM
#7
Thread Killer
Join Date: Aug 2008
Location: Ann Arbor, MI
Posts: 12,484
Bikes: 15 Kinesis Racelight 4S, 76 Motebecane Gran Jubil�e, 17 Dedacciai Gladiatore2, 12 Breezer Venturi, 09 Dahon Mariner, 12 Mercier Nano, 95 DeKerf Team SL, 19 Tern Rally, 21 Breezer Doppler Cafe+, 19 T-Lab X3, 91 Serotta CII, 23 3T Strada
Mentioned: 30 Post(s)
Tagged: 0 Thread(s)
Quoted: 3195 Post(s)
Liked 1,731 Times
in
1,047 Posts
For me, it's always "faster" on the analysis page unless the ride is short, in which case they may be the same. Except of course, Zwift rides. Those are always the same - I assume because the differences in data processing are most important for stop/starts, and there aren't any of those in Zwift.
The effect might be device dependent.
Oh yeah, and Zwift "speeds" are pretty much meaningless to begin with.
The effect might be device dependent.
Oh yeah, and Zwift "speeds" are pretty much meaningless to begin with.
I use a Wahoo Bolt, FWIW.
10-25-21, 02:30 PM
#8
Senior Member
Join Date: Mar 2010
Location: Seattle, WA
Posts: 23,208
Mentioned: 89 Post(s)
Tagged: 0 Thread(s)
Quoted: 18883 Post(s)
Liked 10,646 Times
in
6,054 Posts
I wouldn't be surprised if the top number came from the data of the file, and the average you see next to the speed chart was the average of the values in the chart. You would expect that to be the same thing, but there may be some smoothing, ignoring of zeros, or summarization that happens before the numbers are converted into a graph.
Likes For Seattle Forrest:
10-25-21, 03:53 PM
#9
Senior Member

Join Date: Sep 2017
Location: Upstate SC
Posts: 1,726
Mentioned: 3 Post(s)
Tagged: 0 Thread(s)
Quoted: 835 Post(s)
Liked 1,680 Times
in
789 Posts
It looks like you stopped several times during your ride. Could the difference be "moving average" vs. "trip average"? If you rode, say, 20 miles at 20MPH, but stopped halfway through for a 30 minute break, moving average is 20mph, but trip average is a bit over 13.
10-25-21, 05:38 PM
#10
Senior Member
Thread Starter
Join Date: Aug 2009
Location: Minneapolis
Posts: 5,783
Bikes: 2022 Salsa Beargrease Carbon Deore 11, 2020 Salsa Warbird GRX 600, 2020 Canyon Ultimate CF SLX disc 9.0 Di2, 2020 Catrike Eola, 2016 Masi cxgr, 2011, Felt F3 Ltd, 2010 Trek 2.1, 2009 KHS Flite 220
Mentioned: 20 Post(s)
Tagged: 0 Thread(s)
Quoted: 4422 Post(s)
Liked 3,049 Times
in
1,888 Posts
No, those are both moving average speeds.
10-25-21, 05:50 PM
#11
Senior Member
Thread Starter
Join Date: Aug 2009
Location: Minneapolis
Posts: 5,783
Bikes: 2022 Salsa Beargrease Carbon Deore 11, 2020 Salsa Warbird GRX 600, 2020 Canyon Ultimate CF SLX disc 9.0 Di2, 2020 Catrike Eola, 2016 Masi cxgr, 2011, Felt F3 Ltd, 2010 Trek 2.1, 2009 KHS Flite 220
Mentioned: 20 Post(s)
Tagged: 0 Thread(s)
Quoted: 4422 Post(s)
Liked 3,049 Times
in
1,888 Posts
I wouldn't be surprised if the top number came from the data of the file, and the average you see next to the speed chart was the average of the values in the chart. You would expect that to be the same thing, but there may be some smoothing, ignoring of zeros, or summarization that happens before the numbers are converted into a graph.
Clearly *something* is different and smoothing is a good suspect, but again it's odd that it would result in a systematic bias.
10-25-21, 06:01 PM
#12
Senior Member

Join Date: Nov 2014
Location: Eastern Iowa
Posts: 631
Bikes: 2014 Trek Allant drop bar conversion, modified Schwinn MTN commuter, 2015 Trek 520, Soma ES, Salsa Journeyman, 1980 Trek 414
Mentioned: 0 Post(s)
Tagged: 0 Thread(s)
Quoted: 178 Post(s)
Liked 355 Times
in
166 Posts
I checked a bunch of my rides, and the numbers for average speed matched exactly in both places on every ride. No inconsistencies here.
10-25-21, 06:16 PM
#13
Senior Member
Thread Starter
Join Date: Aug 2009
Location: Minneapolis
Posts: 5,783
Bikes: 2022 Salsa Beargrease Carbon Deore 11, 2020 Salsa Warbird GRX 600, 2020 Canyon Ultimate CF SLX disc 9.0 Di2, 2020 Catrike Eola, 2016 Masi cxgr, 2011, Felt F3 Ltd, 2010 Trek 2.1, 2009 KHS Flite 220
Mentioned: 20 Post(s)
Tagged: 0 Thread(s)
Quoted: 4422 Post(s)
Liked 3,049 Times
in
1,888 Posts
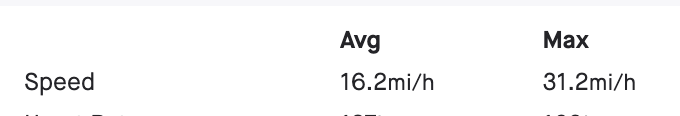
it could be device dependent, but like Chaadster, I'm using a Wahoo Element Bolt. Could be different firmware versions or whatnot.
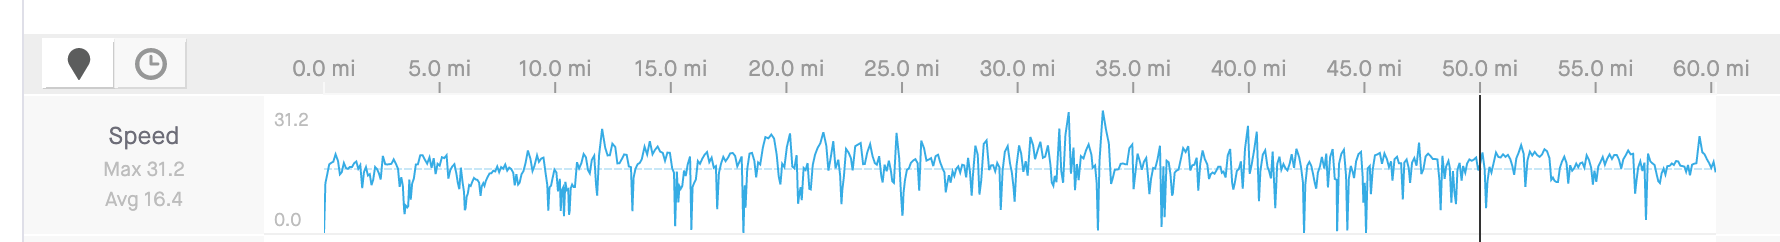
Here are a couple more examples
 10-25-21, 08:11 PM
#14
Fax Transport Specialist

I've had the Element Bolt for just over 4 years now and have noticed similar differences in what is displayed on the Bolt when I finish the ride vs. what is shown when uploaded to Strava. I don't think the difference has ever been more than 0.2 mph, which is pretty small, in fact 1% of 20 mph. 1% seems like a reasonable level of accuracy as that is what a typical power meter would give you as well. My guess is that it's either a rounding difference somewhere or due to more accurate elevation and/or route information that Strava has gathered. GPS is very good, but sometimes it misses a datapoint or two which could be added back in with some sort of path smoothing algorithm. I should add, I think I remember having the same discrepancy with my Garmin Edge 500.
10-26-21, 10:05 AM
#15
Senior Member
Thread Starter
Join Date: Aug 2009
Location: Minneapolis
Posts: 5,783
Bikes: 2022 Salsa Beargrease Carbon Deore 11, 2020 Salsa Warbird GRX 600, 2020 Canyon Ultimate CF SLX disc 9.0 Di2, 2020 Catrike Eola, 2016 Masi cxgr, 2011, Felt F3 Ltd, 2010 Trek 2.1, 2009 KHS Flite 220
Mentioned: 20 Post(s)
Tagged: 0 Thread(s)
Quoted: 4422 Post(s)
Liked 3,049 Times
in
1,888 Posts
I wouldn't be surprised if the top number came from the data of the file, and the average you see next to the speed chart was the average of the values in the chart. You would expect that to be the same thing, but there may be some smoothing, ignoring of zeros, or summarization that happens before the numbers are converted into a graph.
What this comes down to is in fact the same as differences between Strava and "average speeds" reported directly on the devices (Wahoo, Garmin, etc.). These are all affected by the way each algorithm deals with stop/starts.
I just find it odd that Strava has two ways of filtering stop/starts out of the "moving time" data that are internally inconsistent.
10-26-21, 10:28 AM
#16
I'm good to go!
Join Date: Jul 2017
Location: Mississippi
Posts: 15,133
Bikes: Tarmac Disc Comp Di2 - 2020
Mentioned: 51 Post(s)
Tagged: 0 Thread(s)
Quoted: 6278 Post(s)
Liked 4,864 Times
in
3,353 Posts
Programmers use many different buckets to hold values in. Over years as programs get modified, sometimes new buckets are made to hold similar but not quite the same info and a programmer incorrectly grabs the wrong field to use in the various calculations. Some times, the programmers have no idea what the information they are putting on the screen really means.
I'd just put it up to poor Q&A which actually is quite common from things I've been involved with. Sometimes it's a choice of economy because the changes required might actually mean the whole thing has to be tested again as they might break something else or just be too time consuming to re-test.
I once was part of a project that never went live to my knowledge because although the product we made worked perfectly to the best of our knowledge the company that was created for, never could test it completely before the next software release of the OS, databases, or other products used for the entire product. And this was just a IVR that you call in and talked too. But the complexities on the backend the user couldn't see were enormous.
Likes For Iride01:
10-26-21, 10:54 AM
#17
Newbie racer
Join Date: Feb 2018
Posts: 3,406
Bikes: Propel, red is faster
Mentioned: 34 Post(s)
Tagged: 0 Thread(s)
Quoted: 1575 Post(s)
Liked 1,569 Times
in
974 Posts
It takes paid Strava to do, but I setup private segments along routes I do a lot to track the speed stuff better. I know where the stops/pauses are. Overall route average doesn't interest me due to the varying nature of it. It's only really useful in a plus or minus 5 to 10min kind of way for being able to choose a route to ride based on how long you have available to you.
The private segments are a better indicator as they auto list prior personal tries, with power used. So you can see how you do.
Average speed is an age old trapping of Strava to worry about. For needing it to plan routes, it's useful as-is without worrying about losing a couple tenths of a mph on a ride.
Funny story, used to have a guy in the A group set his autopause on a Garmin up in such a way it would ignore anything under like 8mph. No idea how you do that. Either way, several of the little hills on the route he'd be climbing slower than 8mph for 30 seconds at a time. His rides were always shorter than everyone else for this reason by an obvious amount. Excuse he gave was we weren't really doing anything if going slower than that.
One thing I do pay attention to for "good route" versus "bad route" is moving time versus total. If there was no cafe' stop but the delta there is large, bad route. If the delta is a few seconds, good route. More riding less waiting.
10-26-21, 11:02 AM
#18
Senior Member
Join Date: Mar 2010
Location: Seattle, WA
Posts: 23,208
Mentioned: 89 Post(s)
Tagged: 0 Thread(s)
Quoted: 18883 Post(s)
Liked 10,646 Times
in
6,054 Posts
If the x-axis is distance, rather than time, the graphically "averaged" velocity is nonsense. You know that. It's possible that the algorithm calculates a graphical average with elapsed moving time as the independent variable, And then maybe smoothing could introduce a difference, though I don't see why that difference would be systematic as compared to the mathematically rigorous quotient (total accrued distance/total moving time). "Ignoring zeros" would amount a different extraction of "moving time" as compared to another calculation, and though this is possible, one wonders why they would have two different methods for calculating moving time - which after all, has to be extracted from the same original data, whether they plot it or not.
Clearly *something* is different and smoothing is a good suspect, but again it's odd that it would result in a systematic bias.
Clearly *something* is different and smoothing is a good suspect, but again it's odd that it would result in a systematic bias.
10-26-21, 11:38 AM
#19
Senior Member
Thread Starter
Join Date: Aug 2009
Location: Minneapolis
Posts: 5,783
Bikes: 2022 Salsa Beargrease Carbon Deore 11, 2020 Salsa Warbird GRX 600, 2020 Canyon Ultimate CF SLX disc 9.0 Di2, 2020 Catrike Eola, 2016 Masi cxgr, 2011, Felt F3 Ltd, 2010 Trek 2.1, 2009 KHS Flite 220
Mentioned: 20 Post(s)
Tagged: 0 Thread(s)
Quoted: 4422 Post(s)
Liked 3,049 Times
in
1,888 Posts
I don't really use Strava, in Garmin you can make the X axis time or distance, but that's not what I mean. What I mean is this. You have more data points in your file than you have pixels on the X axis on that chart. Each pixel in the chart represents some amount of time, it might just be the highest or lowest value. My suspicion as a developer who fixes bugs for a living is that the average speed shown next to the chart comes from the Y values and they're being summarized incorrectly. I don't have a way to test that hunch, but in terms of how software is put together, it feels pretty likely.
10-26-21, 12:28 PM
#20
Senior Member
Thread Starter
Join Date: Aug 2009
Location: Minneapolis
Posts: 5,783
Bikes: 2022 Salsa Beargrease Carbon Deore 11, 2020 Salsa Warbird GRX 600, 2020 Canyon Ultimate CF SLX disc 9.0 Di2, 2020 Catrike Eola, 2016 Masi cxgr, 2011, Felt F3 Ltd, 2010 Trek 2.1, 2009 KHS Flite 220
Mentioned: 20 Post(s)
Tagged: 0 Thread(s)
Quoted: 4422 Post(s)
Liked 3,049 Times
in
1,888 Posts
I don't really use Strava, in Garmin you can make the X axis time or distance, but that's not what I mean. What I mean is this. You have more data points in your file than you have pixels on the X axis on that chart. Each pixel in the chart represents some amount of time, it might just be the highest or lowest value. My suspicion as a developer who fixes bugs for a living is that the average speed shown next to the chart comes from the Y values and they're being summarized incorrectly. I don't have a way to test that hunch, but in terms of how software is put together, it feels pretty likely.
One complication is that the numbers to the side of the plot always faithfully record the same maximum speed as the maximum speed in the summary. They are never smoothed or filtered out. AND, if one looks carefully at the trace of pixels in the plots, those maximum speeds are rarely and possibly never actually plotted. The plotted speeds are indeed filtered. But the values of Max and Avg that appear to the left of the plot don't seem to come from the plots themselve.
10-26-21, 12:43 PM
#21
Senior Member
Join Date: Mar 2010
Location: Seattle, WA
Posts: 23,208
Mentioned: 89 Post(s)
Tagged: 0 Thread(s)
Quoted: 18883 Post(s)
Liked 10,646 Times
in
6,054 Posts
This is not what's going on for you, but misery loves company and sometimes birds of a feather... In Garminland there's a 24 hour HR chart, with your movement level and recorded activities superimposed over it. That info comes from your all day data, which they seem to store in 5 minute increments. So my daily max HR is always reported lower than what it actually hit going up the short but punchy hills around here.
What I would do personally if I really wanted to know is open the fit file in Golden Cheetah to get the raw data, bring it into Excel or SQL, and then try to come up with their numbers.
What I would do personally if I really wanted to know is open the fit file in Golden Cheetah to get the raw data, bring it into Excel or SQL, and then try to come up with their numbers.
10-26-21, 12:50 PM
#22
Senior Member
Thread Starter
Join Date: Aug 2009
Location: Minneapolis
Posts: 5,783
Bikes: 2022 Salsa Beargrease Carbon Deore 11, 2020 Salsa Warbird GRX 600, 2020 Canyon Ultimate CF SLX disc 9.0 Di2, 2020 Catrike Eola, 2016 Masi cxgr, 2011, Felt F3 Ltd, 2010 Trek 2.1, 2009 KHS Flite 220
Mentioned: 20 Post(s)
Tagged: 0 Thread(s)
Quoted: 4422 Post(s)
Liked 3,049 Times
in
1,888 Posts
The summary value is the ones your friends see, and it's always lower than the one in the analysis section. NBD.
10-26-21, 01:11 PM
#23
Arizona Dessert

Join Date: Jun 2004
Location: AZ
Posts: 15,029
Bikes: Cannondale SuperSix, Lemond Poprad. Retired: Jamis Sputnik, Centurion LeMans Fixed, Diamond Back ascent ex
Mentioned: 76 Post(s)
Tagged: 0 Thread(s)
Quoted: 5345 Post(s)
Liked 2,169 Times
in
1,288 Posts
I see this too

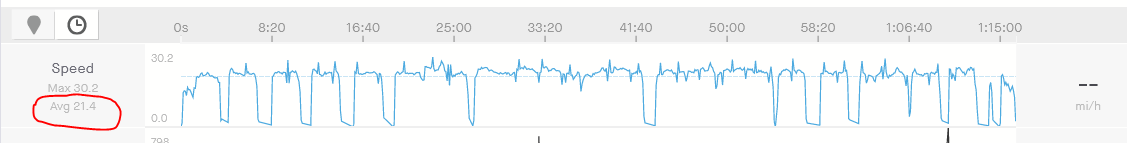
If I calculate my average speed based on moving time provided in summary (1:07:58) over 24.05 miles I get 21.2mph, remove 30s from moving time and it is 21.4.
The higher analysis value could be from removing movement recorded during full extended stops - a subset of what SF is suggesting.
If I calculate my average speed based on moving time provided in summary (1:07:58) over 24.05 miles I get 21.2mph, remove 30s from moving time and it is 21.4.
The higher analysis value could be from removing movement recorded during full extended stops - a subset of what SF is suggesting.
Last edited by noisebeam; 10-26-21 at 01:18 PM.
