


Just started training with Power? Post your questions/comments here!
 11-06-10, 01:44 PM
#2776
going roundy round

Join Date: Dec 2005
Location: High Point, NC
Posts: 6,086
Mentioned: 0 Post(s)
Tagged: 0 Thread(s)
Quoted: 4 Post(s)
Likes: 0
Liked 4 Times
in
4 Posts
I think I remember Ze saying something to the effect of don't worry about hitting a few spikes in wattage as long as you don't spend an extended time there. I try to shoot for just above the midpoint of my Zone 2 range as an average.
Oh yeah, It's alot easier on a trainer - until your butt goes numb.
 11-06-10, 02:11 PM
#2777
Bat�w� Creakcreak
Thread Starter
Join Date: Jan 2007
Location: The illadelph
Posts: 20,791
Mentioned: 1 Post(s)
Tagged: 0 Thread(s)
Quoted: 229 Post(s)
Liked 288 Times
in
160 Posts
Allen & Coggan states that it's okay to go over the limit when going up hills, but is there a percentage above the highest power for the zone over which you shouldn't go? For example, the high limit for my endurance and tempo zones are 190W and 230W, respectively. What would be a good number to shoot for when cresting a hill when during a work out in either zone?
Also, say when I'm doing an endurance ride, the zone for which is between 142-190W, what's a good final average power to shoot for? I'm finding it hard to keep the average power (156 AP, 168 NP) up despite trying to hold it between 170-190W for most of the time. This pacing thing is gonna take me quite a bit to get used to...
Also, say when I'm doing an endurance ride, the zone for which is between 142-190W, what's a good final average power to shoot for? I'm finding it hard to keep the average power (156 AP, 168 NP) up despite trying to hold it between 170-190W for most of the time. This pacing thing is gonna take me quite a bit to get used to...
You're training WITH power, not training BY power. Doing the latter is going to destroy any interest you have in training.
11-06-10, 11:38 PM
#2779
Senior Member
Help with ride upload
Hey guys - I tried out a PT for the first time today. Captured ride with my Garmin Edge 500 but when I save to a .tcx file from Garmin Connect I seem to only get zeros for power. I tried uploading in both Poweragent and Golden Cheetah with the same results. Can someone please help the ignorant? Thanks. Here is the ride: https://connect.garmin.com/activity/55735448
11-07-10, 07:57 AM
#2780

negligent.
Join Date: Aug 2005
Location: White Plains, NY
Posts: 837
Bikes: a few
Mentioned: 0 Post(s)
Tagged: 0 Thread(s)
Quoted: 0 Post(s)
Likes: 0
Liked 0 Times
in
0 Posts
don't save to a .tcx file, just upload directly from the edge to garmin connect. garmin connect can handle the .fit files.
11-07-10, 08:07 AM
#2781
Senior Member

Join Date: May 2007
Location: Santa Cruz Mountains
Posts: 6,169
Mentioned: 0 Post(s)
Tagged: 0 Thread(s)
Quoted: 2 Post(s)
Likes: 0
Liked 1 Time
in
1 Post
With GoldenCheetah you just mount the 500 as a USB drive, select import from file, and read the .fit files right off the 500. Works great.
You need a dev build to do it though as 1.3 doesn't have fit support. 1.4 should be out soon.
You need a dev build to do it though as 1.3 doesn't have fit support. 1.4 should be out soon.
11-07-10, 09:50 AM
#2782
Bat�w� Creakcreak
Thread Starter
Join Date: Jan 2007
Location: The illadelph
Posts: 20,791
Mentioned: 1 Post(s)
Tagged: 0 Thread(s)
Quoted: 229 Post(s)
Liked 288 Times
in
160 Posts
For the rest of your ride, stay in the endurance zone, but don't worry if it's lower than what you want it to be. You need to keep pedaling and making sure to check that you're not getting lazy or going too hard the rest of the time.
I think a good 2-3 hr ride idea is to do 20 min end, 20 min tempo, 20 min end, 20 min tempo, etc. Try it. You'll get better at pacing as time goes on. Doing the intervals at tempo (and not threshold) will teach you how to pace, while still making you do the kind of work you need to be doing at this point of the year.
11-07-10, 10:22 AM
#2783
Senior Member
I uploaded my ride to Garmin Connect as linked, and it shows the power data. The display though is limited and I have not figured out how to view it in PowerAgent or something else to better zero in, look at 5 second power, etc, to better interpret the data. For example the garmin data says I hit nearly 1200 watts but the graph surely doesn't show that, although I did do a couple brief sprints. Anyway, I downloaded version 1.3 of Golden Cheetah so will look for the 1.4. thanks, guys
11-07-10, 10:52 AM
#2784
fuggitivo solitario
RTC, this is very helpful. Thanks again. My problem now is that the powertap LYC displays only three lines of info, and i can't view both average and current power at the same time. Oh well, looks like a Garmin would be pretty helpful after all. By all accounts, my current set up is ridiculously cluttered: i have my old computer for speed and cadence, and the LYC for power, HR, and time.
change the smoothing setting used in GC. Standard would be 10 sec. It'd be pretty hard to see it if you are doing rolling averages by 11 sec to find a peak 1sec max power.
I uploaded my ride to Garmin Connect as linked, and it shows the power data. The display though is limited and I have not figured out how to view it in PowerAgent or something else to better zero in, look at 5 second power, etc, to better interpret the data. For example the garmin data says I hit nearly 1200 watts but the graph surely doesn't show that, although I did do a couple brief sprints. Anyway, I downloaded version 1.3 of Golden Cheetah so will look for the 1.4. thanks, guys
11-07-10, 05:08 PM
#2785
Senior Member
I must be dense as I cannot figure out how to change this setting in GC? Also, if anyone can help me figure out how to upload the data including power to other software I'd greatly appreciate it. Thanks!
11-07-10, 05:37 PM
#2786
fuggitivo solitario
It's in the ride plot tab (second from left) of GC. Near the bottom, it says smoothing (secs) and a text box next to it. The larger the number, the smooth the number, but your 1, and 5 sec bests are going to get averaged out with the power recorded immediately before and after, thus making it hard to see the actual max.
What PM do you have?
What PM do you have?
11-07-10, 11:14 PM
#2787
Senior Member
Sorry, man. I see what you are talking about in GC. I thought you were referring to Garmin Connect. I cannot read the FIT file from the 500 into 1.3 GC directly. It appears when I save it to a TCX file I lose the power data and that is the problem I am having that I need help with. You can see the power data appears to be there in the FIT file I linked above. This was my first ride trying out a PM. PM I'm trying out is a SLC+ PT Edge wheelset which I can get a great deal on. Maybe I just need to go for a Quarq or SRM but that wouldn't solve the FIT file problem. Or I need to figure out how to read the FIT file directly into GC but I don't see where that is supported for windows yet. I thought some people on here are using the Edge 500 to record power data? Any of you have some advice?
11-13-10, 06:34 PM
#2788

Throw the stick!!!!

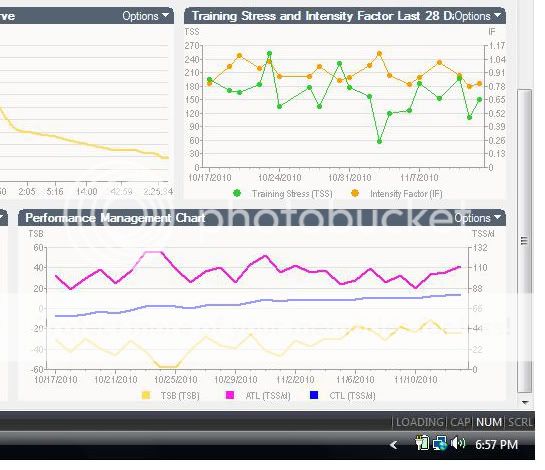
Could someone take a look at these graphs and give me a quick explanation of what the numbers mean? I've been out of it too long and can't remember.
__________________
I may be fat but I'm slow enough to make up for it.
11-13-10, 06:49 PM
#2789
Banned

Join Date: Sep 2005
Location: Santa Barbara, CA
Posts: 28,387
Bikes: Specialized Tarmac SL2, Specialized Tarmac SL, Giant TCR Composite, Specialized StumpJumper Expert HT
Mentioned: 0 Post(s)
Tagged: 0 Thread(s)
Quoted: 0 Post(s)
Likes: 0
Liked 2 Times
in
2 Posts
They say that you didn't set your FTP high enough (all the days with IF > 1)
11-13-10, 06:50 PM
#2790
fuggitivo solitario
For the former. TSS = Training Stress Score. It's basically how "hard" your ride is. It's calculated by taking into account your normalized power and intensity factor (NP/FTP). The formula for TSS is (Time x NP x IF)/(FTP x 3600).
ATL and CTL are acute and chronic training loads, respectively. The former is some sort of a moving average of the TSS of the last seven days while the latter is the moving average of the last 42 days. TSB is training stress balance and is the difference between ATL & CTL. A negative number means you are under stress, and a positive or upward-trending TSB means you are gaining form. Take all three numbers with a grain of salt, but they do give you a qualitative way of seeing how much stress you are putting on your body and how much more stress you could handle.
PS. Depending on how long your rides were when you had ride with IF value >1, it means that your FTP has probably gone up as by definition, a IF of 1 is assigned when you do an one hour effort at FTP.
edit: umd beat me to the second point
11-13-10, 06:56 PM
#2791
Throw the stick!!!!
Thanks guys. I haven't done an actual ftp test yet, I set my ftp by going with my max 20 minutes times .95. I guess I am going to have to do a time trial after all. It's good to know that my ftp is higher than the 267 that I currently have it set at though.
__________________
I may be fat but I'm slow enough to make up for it.
11-13-10, 07:35 PM
#2793
slow up hills

Join Date: Mar 2006
Location: Seattle, WA
Posts: 4,931
Bikes: Giant TCR, Redline CX, Ritchey Breakaway, Spec S-works epic
Mentioned: 0 Post(s)
Tagged: 0 Thread(s)
Quoted: 0 Post(s)
Likes: 0
Liked 0 Times
in
0 Posts
Were you to ride a flat course at your NP over the same amount of time, this is supposed to represent the same effort.
e.g:
one hour of hill repeats : 5 minutes of climbing@300W, with 1 minute of coasting back down @0W = AP of 250W
250 W for an hour is easier than the above workout
NP for the first line might be ~275-280W, which better represents how hard you worked
11-13-10, 07:55 PM
#2794
Banned
Join Date: Sep 2005
Location: Santa Barbara, CA
Posts: 28,387
Bikes: Specialized Tarmac SL2, Specialized Tarmac SL, Giant TCR Composite, Specialized StumpJumper Expert HT
Mentioned: 0 Post(s)
Tagged: 0 Thread(s)
Quoted: 0 Post(s)
Likes: 0
Liked 2 Times
in
2 Posts
Leaving aside the math of how it's calculated, the purpose is to model metabolic demands. The idea being that hard efforts take a significant toll on you (much more than they affect average) and you don't recover that quickly from short rests (much less than they affect the average). Thus spikes in power raise NP quickly and dips drop NP slowly.
11-14-10, 04:54 PM
#2796
Senior Member

Join Date: Oct 2009
Location: Melbourne, Australia
Posts: 910
Mentioned: 0 Post(s)
Tagged: 0 Thread(s)
Quoted: 0 Post(s)
Likes: 0
Liked 0 Times
in
0 Posts
Reposted from training status to see if anyone has any experience with my question below - thanks.
After the wet weekend, got out and did an hour at the hill at the end of my street (~300m long and about 9% average) including cool down.
Interested to know, as the stats below show normalised power was over 400W for the session, giving it a high intensity factor; does this mean my FTP should be higher or is it just the nature of anaerobic intervals that you end up skewing IF scores?
Entire workout (240 watts):
Duration: 57:47 (1:04:08)
Work: 832 kJ
TSS: 113.2 (intensity factor 1.089)
Norm Power: 403
VI: 1.68
Pw:HR: 8.02%
Pa:HR: -19.35%
Distance: 18.826 km
Min Max Avg
Power: 0 1008 240 watts
Heart Rate: 65 171 142 bpm
Cadence: 30 173 78 rpm
Speed: 0 53.8 19.6 kph
Pace 1:07 0:00 3:04 min/km
Hub Torque: 0 7.1 1.6 N-m
Crank Torque: 0 193.6 30.3 N-m
I did 13 x anaerobic intervals and 10 x VO2Max and Threshold intervals.
Changing FTP to 390 from 370 gives me 101.9TSS and IF 1.033 for the ride - perhaps that would be better?
Anyway, got a RAMP/MAP test due Tuesday week so should show up there anyway (just need to do one more minute to get it to show FTP @ ~393 - need to MAP at 525W).
11-14-10, 05:35 PM
#2797
Banned
Join Date: Sep 2005
Location: Santa Barbara, CA
Posts: 28,387
Bikes: Specialized Tarmac SL2, Specialized Tarmac SL, Giant TCR Composite, Specialized StumpJumper Expert HT
Mentioned: 0 Post(s)
Tagged: 0 Thread(s)
Quoted: 0 Post(s)
Likes: 0
Liked 2 Times
in
2 Posts
You have over 6 minutes of stopped time included in that, and it is not being factored into the NP. Fill all of that in with zeros and see how it affects your NP before you do anything else with it.
11-14-10, 05:45 PM
#2798
Senior Member
Join Date: Oct 2009
Location: Melbourne, Australia
Posts: 910
Mentioned: 0 Post(s)
Tagged: 0 Thread(s)
Quoted: 0 Post(s)
Likes: 0
Liked 0 Times
in
0 Posts
I broke a spoke after the first two repeats and went home and changed the wheel. If I take out that front section of two repeats I get:
Continuous:
Duration: 50:20
Work: 753 kJ
TSS: 86 (intensity factor 1.013)
Norm Power: 395
VI: 1.58
Pw:HR: 12.06%
Pa:HR: -24.46%
Distance: 16.938 km
Min Max Avg
Power: 0 994 250 watts
Heart Rate: 110 171 145 bpm
Cadence: 30 173 79 rpm
Speed: 0 53.8 20.2 kph
Pace 1:07 0:00 2:58 min/km
Hub Torque: 0 7.1 1.7 N-m
Crank Torque: 0 193.6 31.3 N-m
- so 395 NP for ~50 minutes
How do you add zeros to WKO+? Do you export it as CSV and reimport it?
Cheers
