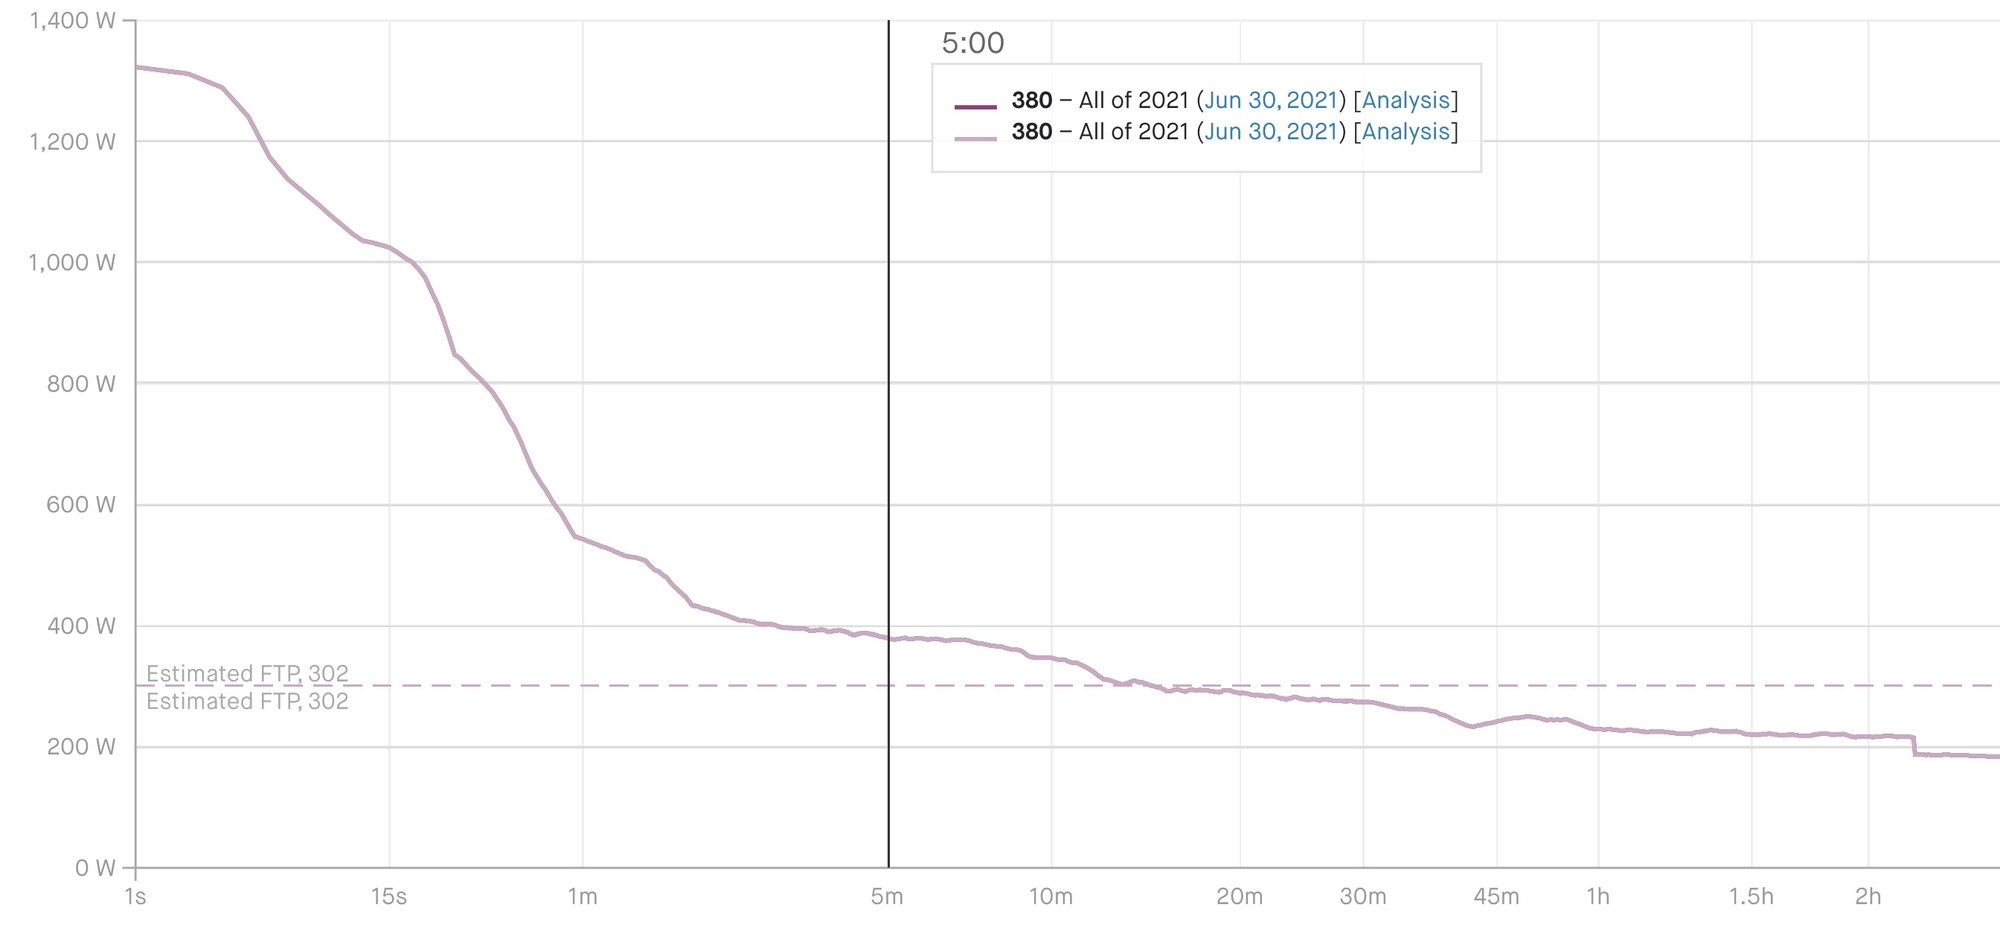
I don’t think that simply comparing graphs will tell us if anyone’s performance is “horrible” or “great,” because the info it contains is not generated the same way between riders. For example, whereas the OP’s and my 90min power is essentially the same, my curve starts getting steeper at 40min, and shows a less pronounced drop-off from peak power. We could say the OP’s 90min is great or my 90min is horrible, but if we consider that I do mostly group rides and weigh a hefty 250lbs, and ride rolling terrain with short climbs, then it kind of explains why I have to generate high “burst” power and why my 90min power looks comparatively low, because I’m spending a lot of time sheltered in a paceline. Of course I don’t know the OP’s particulars and circumstances, but I imagine someone like a lighter rider in flatter terrain probably doesn’t generate the same ratio of extremes as I do. Also, over the years, my power curve looked different when it included data from races and my stationary workouts, neither of which are included in this 2021 graph. So, lots of variables, and while it’s interesting to see the CP curve (and maybe consider how it influences folks’ opinion about bikes, gear, and cycling in general) I’m loathe to use it to make assessments about other’s performance, because it just doesn’t contain the info to tell us that.