


Efficiency Factor - Good for Tracking Fitness Gains?
 03-05-23, 11:17 AM
#26

just another gosling
Join Date: Feb 2007
Location: Everett, WA
Posts: 19,530
Bikes: CoMo Speedster 2003, Trek 5200, CAAD 9, Fred 2004
Mentioned: 115 Post(s)
Tagged: 0 Thread(s)
Quoted: 3886 Post(s)
Liked 1,938 Times
in
1,383 Posts
A personal note: I probably would never have purchased a PM. However my PCP was hit by a car while riding. No damage to him, but his bike was destroyed. So he got the latest carbon bike and I got the PM off the mangled rear wheel and built two better wheels for my bike. Great to have one's PCP for a riding buddy!
__________________
Results matter
Results matter
 03-05-23, 08:04 PM
#27
Senior Member
Join Date: May 2021
Location: San Francisco
Posts: 2,036
Bikes: addict, aethos, creo, vanmoof, sirrus, public ...
Mentioned: 2 Post(s)
Tagged: 0 Thread(s)
Quoted: 1274 Post(s)
Liked 1,392 Times
in
710 Posts
GoldenCheetah seems to divide the ride in two by time and compares the two halves. I can usually tell I am wilting. When I get home, GC confirms. In temperate conditions, decoupling on a 3-4 hour ride might be zero or sometimes slightly negative when fit. When unfit, it can be 20%....
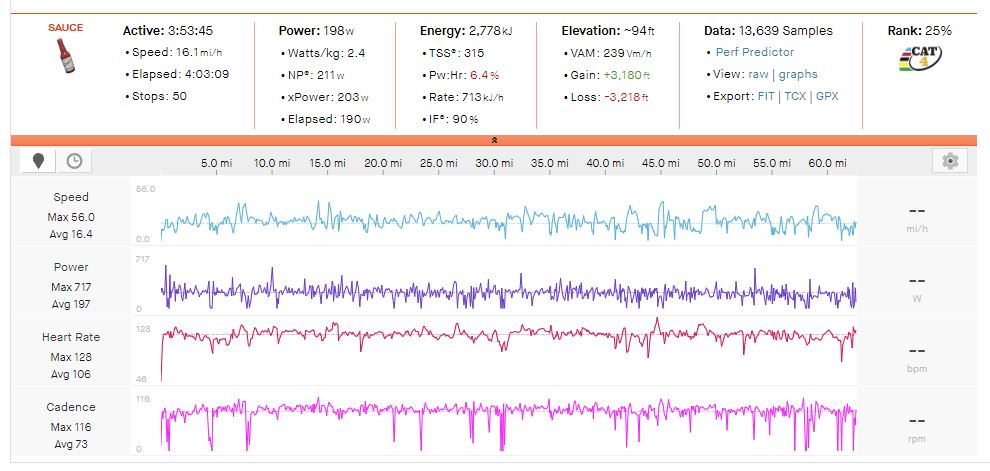
it's interesting comparing it for the entire ride to subsections which felt stronger or weaker. in this ride, for the strongest (first) hour, it's -0.2%, to the halfway point, only +1%, but then for the first three hours it's +4%, and for the whole ride (3:53 moving time, the last 30 minutes of which was pretty anemic) it's 6.4%. an interesting metric which seems to jive with the onset of a little fatigue and the eventual slow decay to "ok i'm glad this is the end."
__________________


Likes For mschwett:
03-06-23, 05:31 AM
#28
Senior Member
Join Date: May 2021
Posts: 8,417
Mentioned: 12 Post(s)
Tagged: 0 Thread(s)
Quoted: 4399 Post(s)
Liked 4,844 Times
in
2,997 Posts
This is interesting.
I tend to look at my HR vs Power on a ride by ride basis. I look out for HR drift on longer endurance rides and general HR vs Power at steady state. Sometimes I find that my HR can look relatively low at endurance power, which sounds great, but it's actually just because I'm fatigued. The key here is how it lines up with my perceived effort. Something that Dr San Millan mentioned in one of his interviews.
For more intense rides I look more at HR recovery time between efforts and how dynamic my HR is with changes in power. When I'm fatigued I find my HR is a lot less dynamic. Everything is just more flat and power is generally down.
EF sounds like it could be useful when comparing rides of the same duration and intensity, but it's not something I track over any significant period of time.
03-06-23, 06:57 AM
#29
� �
Join Date: Jun 2015
Location: Land of Pleasant Living
Posts: 12,230
Bikes: Shmikes
Mentioned: 59 Post(s)
Tagged: 0 Thread(s)
Quoted: 10165 Post(s)
Liked 5,856 Times
in
3,153 Posts
I use decoupling for endurance workouts, particularly on the trainer, as an indication I’m getting the duration right. I want something positive but under 5. I think I got this from something Seiler wrote.
03-06-23, 07:39 AM
#30
Senior Member
Join Date: Apr 2021
Posts: 4,083
Mentioned: 6 Post(s)
Tagged: 0 Thread(s)
Quoted: 2333 Post(s)
Liked 2,097 Times
in
1,314 Posts
i just looked at this for the first time; in sauce they refer to it as pw:hr "a measurement of aerobic decoupling..."
it's interesting comparing it for the entire ride to subsections which felt stronger or weaker. in this ride, for the strongest (first) hour, it's -0.2%, to the halfway point, only +1%, but then for the first three hours it's +4%, and for the whole ride (3:53 moving time, the last 30 minutes of which was pretty anemic) it's 6.4%. an interesting metric which seems to jive with the onset of a little fatigue and the eventual slow decay to "ok i'm glad this is the end."
it's interesting comparing it for the entire ride to subsections which felt stronger or weaker. in this ride, for the strongest (first) hour, it's -0.2%, to the halfway point, only +1%, but then for the first three hours it's +4%, and for the whole ride (3:53 moving time, the last 30 minutes of which was pretty anemic) it's 6.4%. an interesting metric which seems to jive with the onset of a little fatigue and the eventual slow decay to "ok i'm glad this is the end."
03-06-23, 09:36 AM
#31
Senior Member
Join Date: May 2021
Location: San Francisco
Posts: 2,036
Bikes: addict, aethos, creo, vanmoof, sirrus, public ...
Mentioned: 2 Post(s)
Tagged: 0 Thread(s)
Quoted: 1274 Post(s)
Liked 1,392 Times
in
710 Posts
yes and no - i have a lot of "endurance" but no top end, at all. i can hold 200-220 essentially indefinitely with some food and drink, but could not, for example, do 300w for an hour, in part because my max HR is 135. so i can do 1000w for 30 seconds, 300w for a couple minutes, and then from there it's 220 for days.
__________________
Likes For mschwett:
03-06-23, 10:08 AM
#32
Perceptual Dullard
Join Date: Sep 2009
Posts: 2,417
Mentioned: 36 Post(s)
Tagged: 0 Thread(s)
Quoted: 918 Post(s)
Liked 1,149 Times
in
491 Posts
Long ago, in the last millenium, before there were many power meters or especially power analysis programs, SRM used to provide software so you could analyze your SRM files. One of the screens was a power-HR screen, which plotted time-averaged power (I *think* it was something like 30 second running average power) against time-averaged HR (30-second running average HR). These plots have high serial correlation so they made swoopy curves. SRM split the data by time not into discrete halves, but into something like sixths, or maybe eighths, then color-coded the curve so you could see how power and HR evolved over time. The plot was indecipherable. "Decoupling" is sort of a single metric that collapses that old SRM plot into a single number that splits the data into two halves and looks at the ratio of watts/hr over each half. I still kinda lean toward thinking this is also indecipherable.
IIRC, this is sorta what that SRM plot looked like:

Edited to add: Actually, I believe there were also some reference lines, like a line that showed the regression of power on hr, and vertical and horizontal lines that showed mean hr and mean power. Someone once asked me, what does that plot mean? I believe I said, it says, "Mama, look at what I did !!" and then the proud mother tapes it to the refrigerator.
IIRC, this is sorta what that SRM plot looked like:
Edited to add: Actually, I believe there were also some reference lines, like a line that showed the regression of power on hr, and vertical and horizontal lines that showed mean hr and mean power. Someone once asked me, what does that plot mean? I believe I said, it says, "Mama, look at what I did !!" and then the proud mother tapes it to the refrigerator.
Last edited by RChung; 03-06-23 at 10:13 AM.
03-06-23, 10:44 AM
#33
� �
Join Date: Jun 2015
Location: Land of Pleasant Living
Posts: 12,230
Bikes: Shmikes
Mentioned: 59 Post(s)
Tagged: 0 Thread(s)
Quoted: 10165 Post(s)
Liked 5,856 Times
in
3,153 Posts
The app I use gives you a 10 min moving average of power/HR compared to the same ratio over a fixed period in the first half of the ride. I think that makes a fair amount of sense for capturing time-related effects during long, fairly constant, efforts, e.g., on flat ground or a trainer. I don't think it make much sense otherwise.
03-06-23, 09:02 PM
#34
Senior Member
Join Date: May 2021
Location: San Francisco
Posts: 2,036
Bikes: addict, aethos, creo, vanmoof, sirrus, public ...
Mentioned: 2 Post(s)
Tagged: 0 Thread(s)
Quoted: 1274 Post(s)
Liked 1,392 Times
in
710 Posts
The app I use gives you a 10 min moving average of power/HR compared to the same ratio over a fixed period in the first half of the ride. I think that makes a fair amount of sense for capturing time-related effects during long, fairly constant, efforts, e.g., on flat ground or a trainer. I don't think it make much sense otherwise.
__________________
03-07-23, 05:41 AM
#35
� �
Join Date: Jun 2015
Location: Land of Pleasant Living
Posts: 12,230
Bikes: Shmikes
Mentioned: 59 Post(s)
Tagged: 0 Thread(s)
Quoted: 10165 Post(s)
Liked 5,856 Times
in
3,153 Posts
03-07-23, 10:45 AM
#36
Senior Member
Join Date: May 2021
Location: San Francisco
Posts: 2,036
Bikes: addict, aethos, creo, vanmoof, sirrus, public ...
Mentioned: 2 Post(s)
Tagged: 0 Thread(s)
Quoted: 1274 Post(s)
Liked 1,392 Times
in
710 Posts
__________________
03-07-23, 11:19 AM
#37
� �
Join Date: Jun 2015
Location: Land of Pleasant Living
Posts: 12,230
Bikes: Shmikes
Mentioned: 59 Post(s)
Tagged: 0 Thread(s)
Quoted: 10165 Post(s)
Liked 5,856 Times
in
3,153 Posts
03-08-23, 06:00 AM
#38
Senior Member
Join Date: May 2021
Posts: 8,417
Mentioned: 12 Post(s)
Tagged: 0 Thread(s)
Quoted: 4399 Post(s)
Liked 4,844 Times
in
2,997 Posts
03-21-23, 11:44 AM
#39
Senior Member
Join Date: Aug 2009
Location: Minneapolis
Posts: 5,751
Bikes: 2022 Salsa Beargrease Carbon Deore 11, 2020 Salsa Warbird GRX 600, 2020 Canyon Ultimate CF SLX disc 9.0 Di2, 2020 Catrike Eola, 2016 Masi cxgr, 2011, Felt F3 Ltd, 2010 Trek 2.1, 2009 KHS Flite 220
Mentioned: 20 Post(s)
Tagged: 0 Thread(s)
Quoted: 4387 Post(s)
Liked 3,016 Times
in
1,865 Posts
I appreciate this thread. The relationship between HR, power, and fitness is something I've thought about casually, but not delved in to with any seriousness. I 've figured that day to day variability, and even within-ride variability, is so great that the signal/noise ratio would be too high. Anecdotally, I find that my hour long sessions with Zwift pace partners, are good measures of this kind of efficiency. These are the closest I come to steady effort for a good standard time interval, and so they make better comparisons than other more varied rides.
I'm impressed with the OP's progression over the course of a season. If I'm reading those graphs correctly, going from a ratio of 0.6 to 1.25 is a huge gain - i.e., starting out at 90 watts @150 bpm and finishing at 190 watts @ 150 bpm. That's a huge difference.
I'm impressed with the OP's progression over the course of a season. If I'm reading those graphs correctly, going from a ratio of 0.6 to 1.25 is a huge gain - i.e., starting out at 90 watts @150 bpm and finishing at 190 watts @ 150 bpm. That's a huge difference.
Likes For MinnMan:
03-22-23, 04:46 AM
#40
Senior Member
Join Date: May 2021
Posts: 8,417
Mentioned: 12 Post(s)
Tagged: 0 Thread(s)
Quoted: 4399 Post(s)
Liked 4,844 Times
in
2,997 Posts
That's a good point. I can't believe that's a real improvement and more likely something related to the type of rides being compared during the season. My steady state endurance power certainly doesn't vary by 100W over the course of a season!
03-22-23, 09:37 AM
#41
climber has-been
Thread Starter

Join Date: Dec 2004
Location: Palo Alto, CA
Posts: 7,102
Bikes: Scott Addict R1, Felt Z1
Mentioned: 10 Post(s)
Tagged: 0 Thread(s)
Quoted: 3427 Post(s)
Liked 3,563 Times
in
1,790 Posts
Here's a "just got back on the bike" ride, and a "middle of the season" ride, both in 2021. Similar routes. Weighed avg. power went from 101-156 watts, while heart rate went from 140-136 bpm. Perceived effort went from "pretty hard" to "pretty easy".
__________________
Ride, Rest, Repeat. ROUVY: terrymorse

Ride, Rest, Repeat. ROUVY: terrymorse
Likes For terrymorse:
03-22-23, 10:54 AM
#42
Perceptual Dullard
Join Date: Sep 2009
Posts: 2,417
Mentioned: 36 Post(s)
Tagged: 0 Thread(s)
Quoted: 918 Post(s)
Liked 1,149 Times
in
491 Posts
Here's a "just got back on the bike" ride, and a "middle of the season" ride, both in 2021. Similar routes. Weighed avg. power went from 101-156 watts, while heart rate went from 140-136 bpm. Perceived effort went from "pretty hard" to "pretty easy".
03-22-23, 11:01 AM
#43
climber has-been
Thread Starter
Join Date: Dec 2004
Location: Palo Alto, CA
Posts: 7,102
Bikes: Scott Addict R1, Felt Z1
Mentioned: 10 Post(s)
Tagged: 0 Thread(s)
Quoted: 3427 Post(s)
Liked 3,563 Times
in
1,790 Posts
Yes, it looks like that March ride was Strava-estimated power.
Maybe these 2022 rides area a more fair comparison:
2022-06-25 Pwr: 104, HR: 138, Pwr:HR: 0.75
2022-09-15 Pwr: 140, HR: 125, Pwr:HR: 1.12
Maybe these 2022 rides area a more fair comparison:
2022-06-25 Pwr: 104, HR: 138, Pwr:HR: 0.75
2022-09-15 Pwr: 140, HR: 125, Pwr:HR: 1.12
__________________
Ride, Rest, Repeat. ROUVY: terrymorse
Ride, Rest, Repeat. ROUVY: terrymorse
Last edited by terrymorse; 03-22-23 at 11:09 AM.
06-25-23, 04:35 PM
#44
Senior Member
Join Date: May 2021
Location: San Francisco
Posts: 2,036
Bikes: addict, aethos, creo, vanmoof, sirrus, public ...
Mentioned: 2 Post(s)
Tagged: 0 Thread(s)
Quoted: 1274 Post(s)
Liked 1,392 Times
in
710 Posts
bumping this rather than creating a new thread with a similar topic. can anyone summarize (better than google or chatGPT  ) the factors that drive "power per BPM" in cycling? i note from terry's results that power went up, heart rate went down.
muscles need oxygen, so we've got heart rate, stroke volume / ejection fraction, blood pressure, maybe the oxygen binding capacity of the blood? is the way blood sugar gets delivered, replenished, etc a factor? respiration rate and volume, presumably if those are too low even good blood flow doesn't deliver oxygen.
probably because of my unique cardiac situation, i don't think any kind of "training" is really making me a stronger cyclist. there were rapid gains a few years ago but flat since then, but i've noticed that the difference between a ride that feels REALLY great and one that just feels OK or good is around a 10% difference in the Pwr:HR factor discussed here. on friday i went out at approx 1pm, and was really easily holding 220w for an hour, potentially could have done quite a bit more without starts and stops and descents. 223w average (un-weighted) power for one hour with 115 BPM average for the same time period. so 1.94. today, another really nice ride, starting at 8am, 201w average for one hour (not the first hour of the ride, but similar) at 112bpm, so 1.79.
that difference - 1.79 to 1.94 - is hard for me to explain and seems to vary somewhat randomly. it's immediately obvious after a minute or two on the bike which kind of day it's going to be!
both rides mentioned are quite a bit above the trend line, which i attribute to not having taking my meds in the AM either day, which i've started to do on ride days.

) the factors that drive "power per BPM" in cycling? i note from terry's results that power went up, heart rate went down.muscles need oxygen, so we've got heart rate, stroke volume / ejection fraction, blood pressure, maybe the oxygen binding capacity of the blood? is the way blood sugar gets delivered, replenished, etc a factor? respiration rate and volume, presumably if those are too low even good blood flow doesn't deliver oxygen.
probably because of my unique cardiac situation, i don't think any kind of "training" is really making me a stronger cyclist. there were rapid gains a few years ago but flat since then, but i've noticed that the difference between a ride that feels REALLY great and one that just feels OK or good is around a 10% difference in the Pwr:HR factor discussed here. on friday i went out at approx 1pm, and was really easily holding 220w for an hour, potentially could have done quite a bit more without starts and stops and descents. 223w average (un-weighted) power for one hour with 115 BPM average for the same time period. so 1.94. today, another really nice ride, starting at 8am, 201w average for one hour (not the first hour of the ride, but similar) at 112bpm, so 1.79.
that difference - 1.79 to 1.94 - is hard for me to explain and seems to vary somewhat randomly. it's immediately obvious after a minute or two on the bike which kind of day it's going to be!
both rides mentioned are quite a bit above the trend line, which i attribute to not having taking my meds in the AM either day, which i've started to do on ride days.
Last edited by mschwett; 06-25-23 at 04:49 PM.
06-25-23, 05:05 PM
#45
Senior Member
Join Date: Apr 2021
Posts: 4,083
Mentioned: 6 Post(s)
Tagged: 0 Thread(s)
Quoted: 2333 Post(s)
Liked 2,097 Times
in
1,314 Posts
You get bigger and better mitochondria, more enzymes, shuttles to transport the goods, more capillarization. Lungs and heart play second fiddle. With time and training some can push their "FTP" very close to their VO2 max. These adaptations are summarized in the attached.
https://www.sciencedirect.com/scienc...118301864#bib6
https://www.sciencedirect.com/scienc...118301864#bib6
06-25-23, 05:19 PM
#46
Senior Member
Join Date: May 2021
Location: San Francisco
Posts: 2,036
Bikes: addict, aethos, creo, vanmoof, sirrus, public ...
Mentioned: 2 Post(s)
Tagged: 0 Thread(s)
Quoted: 1274 Post(s)
Liked 1,392 Times
in
710 Posts
You get bigger and better mitochondria, more enzymes, shuttles to transport the goods, more capillarization. Lungs and heart play second fiddle. With time and training some can push their "FTP" very close to their VO2 max. These adaptations are summarized in the attached.
https://www.sciencedirect.com/scienc...118301864#bib6
https://www.sciencedirect.com/scienc...118301864#bib6
Likes For mschwett:
06-25-23, 08:38 PM
#47
just another gosling
Join Date: Feb 2007
Location: Everett, WA
Posts: 19,530
Bikes: CoMo Speedster 2003, Trek 5200, CAAD 9, Fred 2004
Mentioned: 115 Post(s)
Tagged: 0 Thread(s)
Quoted: 3886 Post(s)
Liked 1,938 Times
in
1,383 Posts
HR is somewhat cadence dependent, so lower cadence will give a higher EF at the same power. It may be possible to train one's muscles to operate at a lower cadence. For sure there are some riders who can climb passes at a remarkably low cadence, though that may be a genetic ability, IDK. I do know that it's trainable to a certain degree.
__________________
Results matter
Results matter
06-26-23, 06:50 AM
#48
Senior Member
Join Date: Apr 2021
Posts: 4,083
Mentioned: 6 Post(s)
Tagged: 0 Thread(s)
Quoted: 2333 Post(s)
Liked 2,097 Times
in
1,314 Posts
Higher forces tend engage more of the type 2 fast twitch muscles. Glycogen oxidation uses a little less oxygen. But type 2 fibres fatigue quicker. Faster cadence usually means lower peak forces and therefore a higher proportion of type 1 slow twitch fibres being engaged, which costs a little more O2. In addition, there are the inertial effects of rotating two big chunks of meat quicker. Lots of research shows 60 rpm or thereabouts is the most efficient metabolically; yet, many experienced cyclist pedal at much higher rates. Those who train for endurance will have muscle fibre composition shifts (the hybrids), increasing internal efficiency. Lower fatigue when cycling at higher power is probably the main reason for higher cadence than anticipated from lab studies. What is interesting (to me) is looking at the TrainingPeaks power files of top pros during a race. When on the flats in the pack, they might "only" be making 200 watts and invariably, they also pedal at lower cadences (75 rpm or something like that) than when they are on the rivets where they might be making 400 watts at 90-100 rpm.
All well, good and interesting. Myself, I look at how much power I make just shy of VT1 and do I decouple more than 10% in temperate conditions. If I get more than 10%, the ride was probably too much
All well, good and interesting. Myself, I look at how much power I make just shy of VT1 and do I decouple more than 10% in temperate conditions. If I get more than 10%, the ride was probably too much
06-28-23, 05:57 AM
#49
Senior Member
Join Date: May 2021
Posts: 8,417
Mentioned: 12 Post(s)
Tagged: 0 Thread(s)
Quoted: 4399 Post(s)
Liked 4,844 Times
in
2,997 Posts
HR is somewhat cadence dependent, so lower cadence will give a higher EF at the same power. It may be possible to train one's muscles to operate at a lower cadence. For sure there are some riders who can climb passes at a remarkably low cadence, though that may be a genetic ability, IDK. I do know that it's trainable to a certain degree.
Likes For PeteHski:
