


what is up with the strava power curves lately?
 06-19-22, 05:01 PM
#1

Senior Member
Thread Starter
Join Date: May 2021
Location: San Francisco
Posts: 2,044
Bikes: addict, aethos, creo, vanmoof, sirrus, public ...
Mentioned: 2 Post(s)
Tagged: 0 Thread(s)
Quoted: 1284 Post(s)
Liked 1,405 Times
in
714 Posts
what is up with the strava power curves lately?
the timescale is clearly wrong. i like to compare the strongest-one-hour-power for various rides. now i don't know if that's what i'm seeing or not!
this is a 2 hour and 6 minute ride. the time is definitely correct, matches reality, the cycling app the data came from, etc. the timescale on the power curve (for this ride, not for all time) clearly goes to more like 3.5 hours. i see a similar ratio on many, but not all rides. anyone else?n
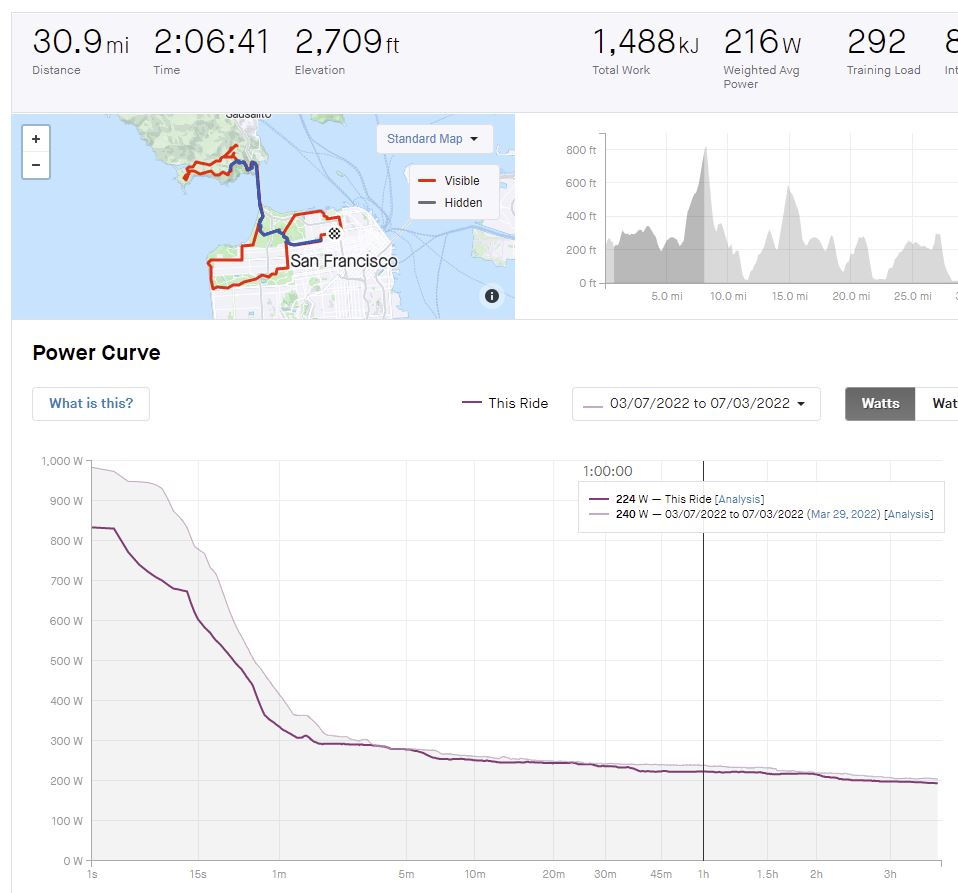
no love on google. https://www.google.com/search?q=stra...client=gws-wiz
this is a 2 hour and 6 minute ride. the time is definitely correct, matches reality, the cycling app the data came from, etc. the timescale on the power curve (for this ride, not for all time) clearly goes to more like 3.5 hours. i see a similar ratio on many, but not all rides. anyone else?n
no love on google. https://www.google.com/search?q=stra...client=gws-wiz
 06-20-22, 12:18 PM
#2
Obsessed with Eddington

Join Date: Jun 2013
Location: Brussels (BE) 🇧🇪
Posts: 1,330
Bikes: '16 Spesh Diverge, '14 Spesh Fatboy, '18 Spesh Epic, '18 Spesh SL6, '21 Spesh SL7, '21 Spesh Diverge...and maybe n+1?
Mentioned: 2 Post(s)
Tagged: 0 Thread(s)
Quoted: 532 Post(s)
Liked 621 Times
in
368 Posts
Yesterday, I did a ride with 2:50:34 moving, but the elapsed time was almost 4 hours. I have attached a screen grab for reference. This got me curious, so I went and verified a few other rides where I knew there was a noticeable difference between the moving time and elapsed time, and those power curves also were based on elapsed time. It appears that the power curve chart is based on the elapsed time.

06-20-22, 03:52 PM
#3
Senior Member
Thread Starter
Join Date: May 2021
Location: San Francisco
Posts: 2,044
Bikes: addict, aethos, creo, vanmoof, sirrus, public ...
Mentioned: 2 Post(s)
Tagged: 0 Thread(s)
Quoted: 1284 Post(s)
Liked 1,405 Times
in
714 Posts
Yesterday, I did a ride with 2 34 moving, but the elapsed time was almost 4 hours. I have attached a screen grab for reference. This got me curious, so I went and verified a few other rides where I knew there was a noticeable difference between the moving time and elapsed time, and those power curves also were based on elapsed time. It appears that the power curve chart is based on the elapsed time.
34 moving, but the elapsed time was almost 4 hours. I have attached a screen grab for reference. This got me curious, so I went and verified a few other rides where I knew there was a noticeable difference between the moving time and elapsed time, and those power curves also were based on elapsed time. It appears that the power curve chart is based on the elapsed time.
06-21-22, 09:18 AM
#4
Obsessed with Eddington
Join Date: Jun 2013
Location: Brussels (BE) 🇧🇪
Posts: 1,330
Bikes: '16 Spesh Diverge, '14 Spesh Fatboy, '18 Spesh Epic, '18 Spesh SL6, '21 Spesh SL7, '21 Spesh Diverge...and maybe n+1?
Mentioned: 2 Post(s)
Tagged: 0 Thread(s)
Quoted: 532 Post(s)
Liked 621 Times
in
368 Posts
Interesting. All of mine (at least the 20 or so I just spot checked from the last 6 weeks) are using the correct elapsed time.
06-21-22, 09:57 AM
#5
Senior Member
Thread Starter
Join Date: May 2021
Location: San Francisco
Posts: 2,044
Bikes: addict, aethos, creo, vanmoof, sirrus, public ...
Mentioned: 2 Post(s)
Tagged: 0 Thread(s)
Quoted: 1284 Post(s)
Liked 1,405 Times
in
714 Posts
so strange. i have to go back very far to find a correct one, but it looks like all the ones uploaded from the cadence cycling app (vs different apps i used to use) are all displayed with the wrong x axis.
what's very interesting is that the numbers seem to be correct; e.g. the one hour average matches what i saw on the bike after the first (usually strongest) hour of the ride. mystifying.
what's very interesting is that the numbers seem to be correct; e.g. the one hour average matches what i saw on the bike after the first (usually strongest) hour of the ride. mystifying.
06-21-22, 11:17 AM
#6

don't try this at home.

Join Date: Jan 2006
Location: N. KY
Posts: 5,968
Mentioned: 10 Post(s)
Tagged: 0 Thread(s)
Quoted: 986 Post(s)
Liked 521 Times
in
358 Posts
Garmin 1030 recordings.
Last week, a ride was 1:46 ride time, 2:06 total time.
The power curve showed 2:06.
In Golden Cheetah, the line extends to 2:06 also. Looks like stopped times are factored in, which makes sense.
That's why my over 1 hour chart line is so low. Rides have at least some stopped time, and downhill coasting too. An interesting experiment would be to do a 2 hour flat ride, trying for a consistent pace with no coasting. Those kind of routes are very hard to find around here, though. A flatland 4-sides-of-a-square repeated loop would be annoying! I want a destination, and stuff to see along the way.
Last edited by rm -rf; 06-21-22 at 11:21 AM.
Likes For rm -rf:
06-21-22, 12:21 PM
#7
Senior Member
Thread Starter
Join Date: May 2021
Location: San Francisco
Posts: 2,044
Bikes: addict, aethos, creo, vanmoof, sirrus, public ...
Mentioned: 2 Post(s)
Tagged: 0 Thread(s)
Quoted: 1284 Post(s)
Liked 1,405 Times
in
714 Posts
Garmin 1030 recordings.
Last week, a ride was 1:46 ride time, 2:06 total time.
The power curve showed 2:06.
In Golden Cheetah, the line extends to 2:06 also. Looks like stopped times are factored in, which makes sense.
That's why my over 1 hour chart line is so low. Rides have at least some stopped time, and downhill coasting too. An interesting experiment would be to do a 2 hour flat ride, trying for a consistent pace with no coasting. Those kind of routes are very hard to find around here, though. A flatland 4-sides-of-a-square repeated loop would be annoying! I want a destination, and stuff to see along the way.
Last week, a ride was 1:46 ride time, 2:06 total time.
The power curve showed 2:06.
In Golden Cheetah, the line extends to 2:06 also. Looks like stopped times are factored in, which makes sense.
That's why my over 1 hour chart line is so low. Rides have at least some stopped time, and downhill coasting too. An interesting experiment would be to do a 2 hour flat ride, trying for a consistent pace with no coasting. Those kind of routes are very hard to find around here, though. A flatland 4-sides-of-a-square repeated loop would be annoying! I want a destination, and stuff to see along the way.
06-21-22, 12:48 PM
#8
Obsessed with Eddington
Join Date: Jun 2013
Location: Brussels (BE) 🇧🇪
Posts: 1,330
Bikes: '16 Spesh Diverge, '14 Spesh Fatboy, '18 Spesh Epic, '18 Spesh SL6, '21 Spesh SL7, '21 Spesh Diverge...and maybe n+1?
Mentioned: 2 Post(s)
Tagged: 0 Thread(s)
Quoted: 532 Post(s)
Liked 621 Times
in
368 Posts
An interesting experiment would be to do a 2 hour flat ride, trying for a consistent pace with no coasting. Those kind of routes are very hard to find around here, though. A flatland 4-sides-of-a-square repeated loop would be annoying! I want a destination, and stuff to see along the way.
The start/end point is 2.5km from house, and it is flat AF until roughly the 70km mark, along train tracks and canals, definitely not a boring 4-corners big square crit. In reality that is a 2:30:00 to 2:35:00 TT. I might just do it. For science, and all.
Last edited by Badger6; 06-21-22 at 12:53 PM.
Likes For Badger6:
07-06-22, 10:20 PM
#9
Senior Member
Thread Starter
Join Date: May 2021
Location: San Francisco
Posts: 2,044
Bikes: addict, aethos, creo, vanmoof, sirrus, public ...
Mentioned: 2 Post(s)
Tagged: 0 Thread(s)
Quoted: 1284 Post(s)
Liked 1,405 Times
in
714 Posts
been emailing strava support about this. it's a bit of a slow conversation as they take a few days to reply between emails... but there's clearly something wrong. they've manually "reset the power curve" for one activity, and it's fixed with the correct x axis duration on the power curve. today's ride is also correct. every other ride for the past months is still wrong though. wierd.
Likes For mschwett:
07-09-22, 08:05 PM
#10
Senior Member
Thread Starter
Join Date: May 2021
Location: San Francisco
Posts: 2,044
Bikes: addict, aethos, creo, vanmoof, sirrus, public ...
Mentioned: 2 Post(s)
Tagged: 0 Thread(s)
Quoted: 1284 Post(s)
Liked 1,405 Times
in
714 Posts
doesn�t seem like anyone else but me has this issue here, but here�s the latest:
here is the latest from strava after a few weeks of emailing back and forth.
it�s basically every ride that i�ve synced to strava from the cadence app on one particular phone for the last several months. they are able to manually �reset� the curve for a specific activity, which fixes it, but it looks like there�s no explanation yet for why they get like they from this particular combo of app/device.
all the data in the app is correct, including averaged and weighted average power, and exported TCX or FIT files from the app also show correctly in other platforms!
here is the latest from strava after a few weeks of emailing back and forth.
It looks like this may be a bug. I will create a bug profile so that our engineers can take a look. I am unsure of the timeline but they will be made aware of the issue.
We appreciate your patience. If you have any additional questions please let us know.
We appreciate your patience. If you have any additional questions please let us know.
all the data in the app is correct, including averaged and weighted average power, and exported TCX or FIT files from the app also show correctly in other platforms!
