


Inverse relationship between Power and Speed?
 11-08-23, 06:47 PM
#1
Inverse relationship between Power and Speed?
For you Garmin Connect users out there, am I right to assume that those of you that ride, on average, at higher speeds also produce more power than the average user in your age group when looking at “Insights”?
I struggle to produce power that resembles anything of other Strava users but I also don’t think I ride relatively slowly. I often have faster segment performances than others but at a much lower average power.
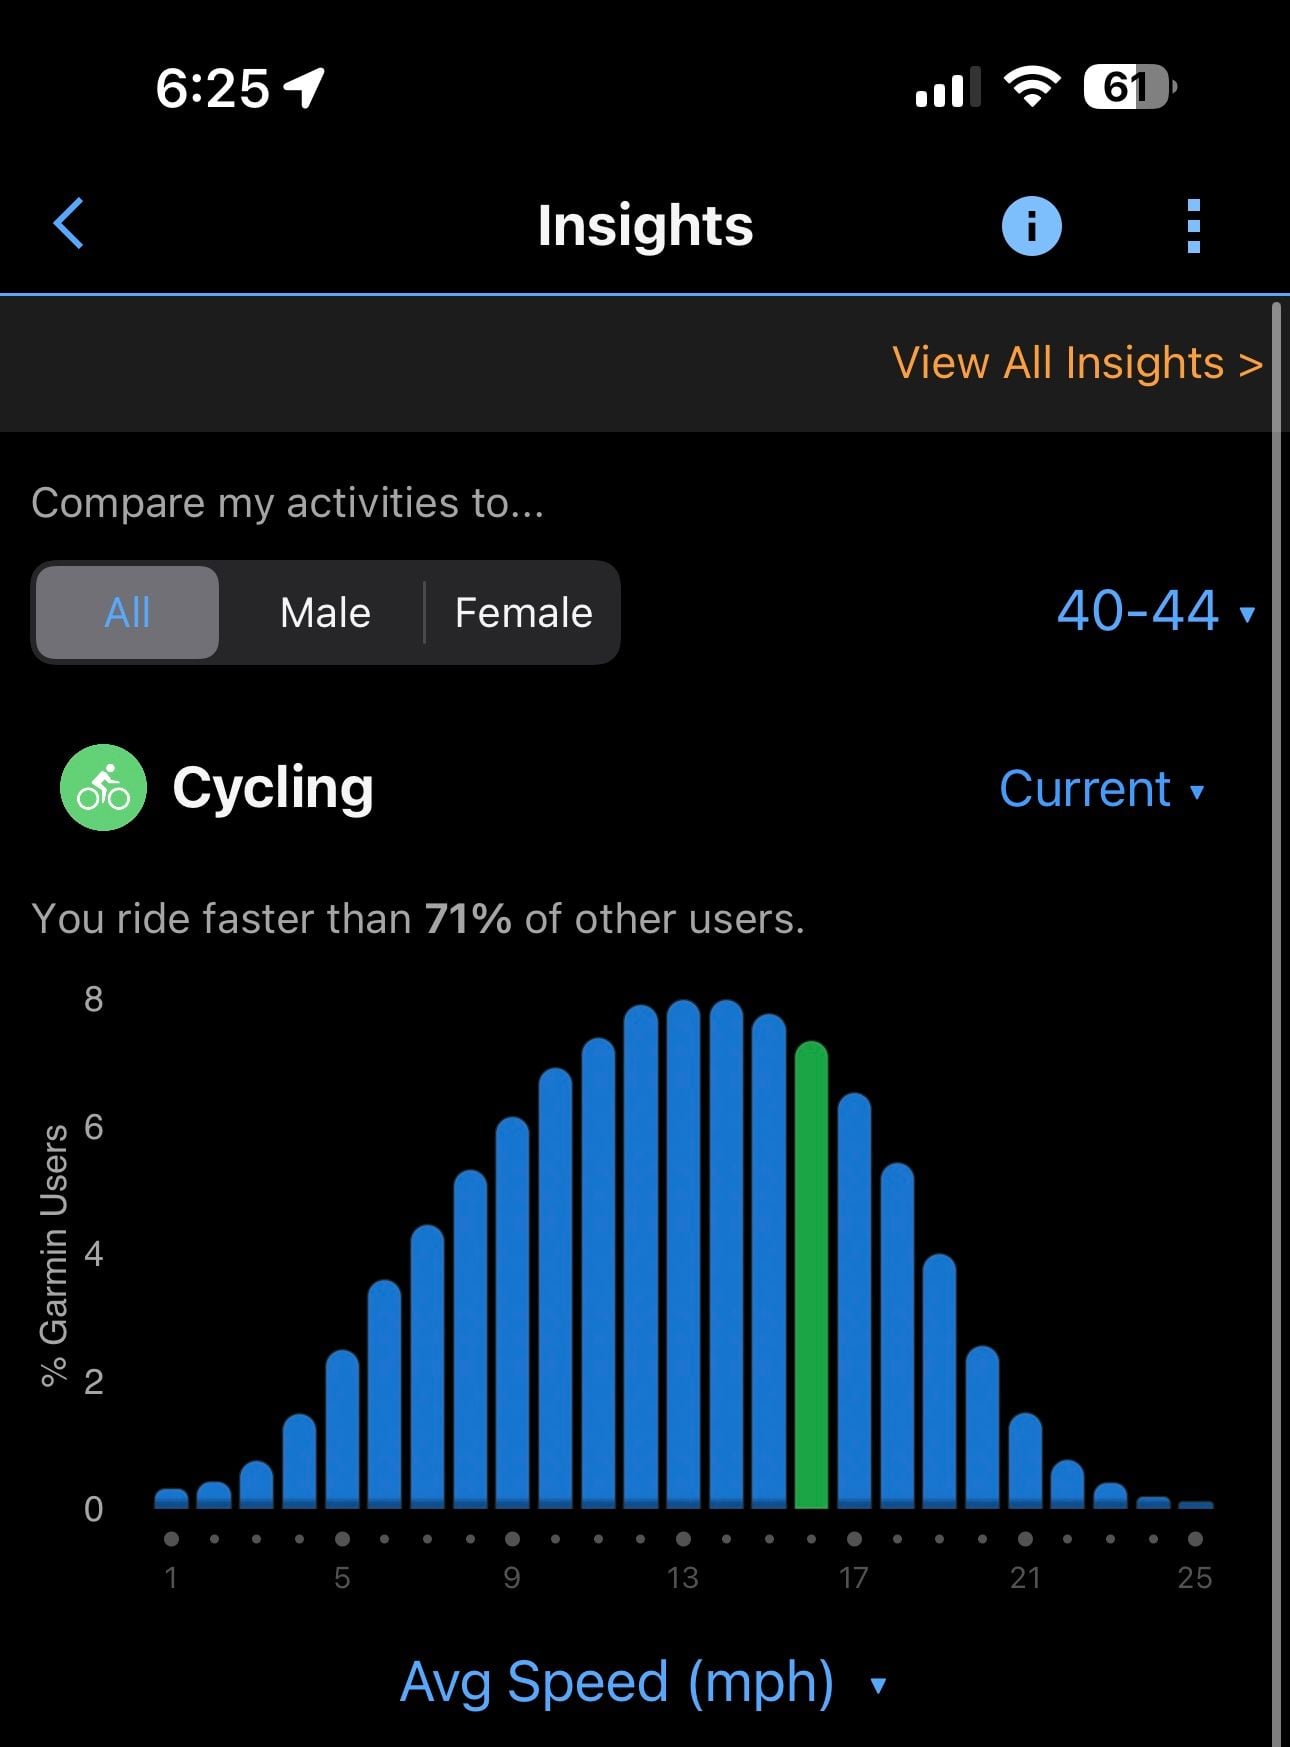
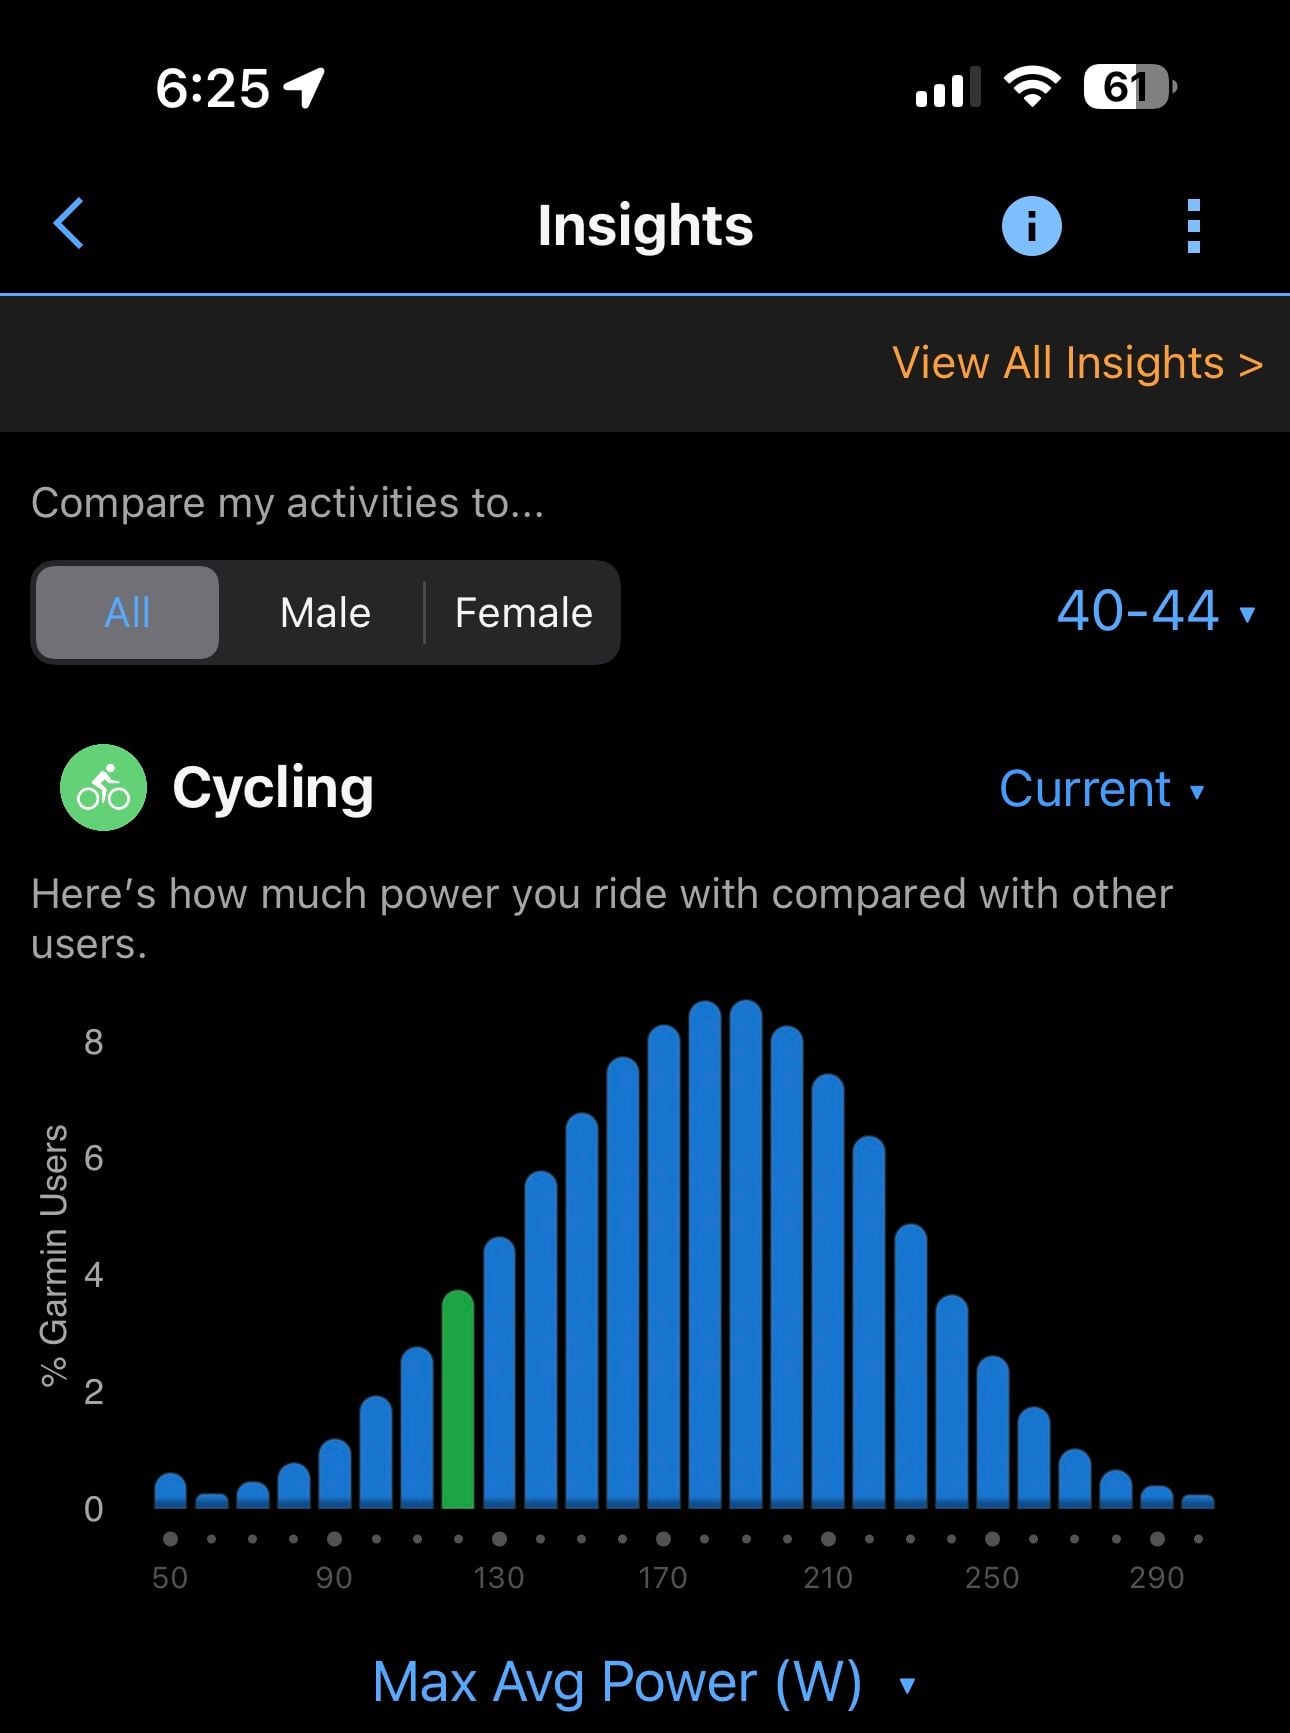
Pulling up Insights in Garmin Connect shows that I produce significantly below average power for my age group, but inversely, my average speed is higher than 71% of other users.
I’m just trying to square why my power output is so low. Initially, I though I might have a faulty left side crank PM but I’ve tried both a Stages Gen 3 and a 4iiii Precision 3+ versions and they’re relatively producing the same numbers.
I struggle to produce power that resembles anything of other Strava users but I also don’t think I ride relatively slowly. I often have faster segment performances than others but at a much lower average power.
Pulling up Insights in Garmin Connect shows that I produce significantly below average power for my age group, but inversely, my average speed is higher than 71% of other users.
I’m just trying to square why my power output is so low. Initially, I though I might have a faulty left side crank PM but I’ve tried both a Stages Gen 3 and a 4iiii Precision 3+ versions and they’re relatively producing the same numbers.
 11-08-23, 08:14 PM
#2
Perceptual Dullard
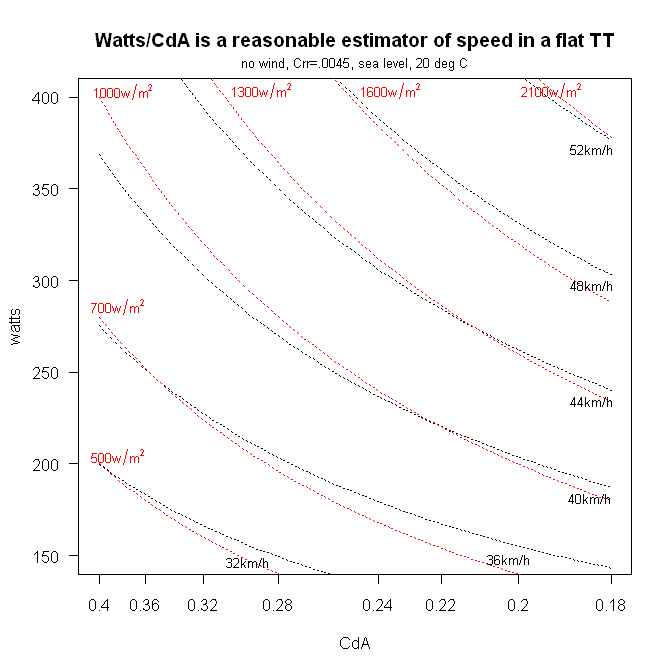
Speed is related to power-to-drag, so if your speed seems high relative to your power, it means your drag is low.
Likes For RChung:
11-09-23, 10:37 AM
#3

I'm good to go!
Join Date: Jul 2017
Location: Mississippi
Posts: 16,167
Bikes: Tarmac Disc Comp Di2 - 2020
Liked 5,406 Times
in
3,731 Posts
Also that power output graph compared to age group probably is not adjusted to watts per kg. So if you are a really light person, you won't need to be putting out the watts to get the speed you are getting compared to the average garmin user that might be a much higher weight average and therefore have to put out more power to move them along.
 11-09-23, 10:57 AM
#4
Just to add to all of the above factors, your riding terrain will also greatly affect speed. Are you roads smooth and relatively flat?
Likes For PeteHski:
11-09-23, 11:22 AM
#5
Senior Member

Join Date: Jul 2013
Location: NJ, USA
Posts: 1,286
Bikes: two blacks, a blue and a white.
Liked 860 Times
in
412 Posts
I don't think that data is from identical populations. In the first case, you're getting a histogram of all Garmn bike-ride recorders (and likely mostly watch users). In the second case, you're getting a histogram of only those who can record power, surely a vastly smaller population.
Likes For blacknbluebikes:
11-09-23, 12:03 PM
#6
climber has-been

Join Date: Dec 2004
Location: Palo Alto, CA
Posts: 7,525
Bikes: Scott Addict R1, Felt Z1
Liked 4,064 Times
in
2,003 Posts
Garmin Connect says my average speed is 78th percentile, but max average power is only 50th percentile.
Speed is a useless measure, as it's dependent on terrain, wind, road surface, aerodynamics, etc.
But what is "max average power"? According to Garmin, it's the highest power recorded over a 20-minute or 60-minute segment. And it records as zero power any time you may have been stopped during that segment. I wouldn't trust that number for much of anything.
Training Peaks tell me that my 20-minute power (watts/kg) is 73rd percentile, my 60-minute power is 84th percentile, and my 90-minute power is 86th percentile. That seems about right (20-minute power probably is low because I'm not doing any 20-minute FTP efforts).
Training Peaks also says that my watts are about the 40th percentile. Which explains why the big guys can destroy me on a flat course.
__________________
Ride, Rest, Repeat. ROUVY: terrymorse

Ride, Rest, Repeat. ROUVY: terrymorse
Last edited by terrymorse; 11-09-23 at 01:40 PM.
11-09-23, 03:42 PM
#7
Also that power output graph compared to age group probably is not adjusted to watts per kg. So if you are a really light person, you won't need to be putting out the watts to get the speed you are getting compared to the average garmin user that might be a much higher weight average and therefore have to put out more power to move them along.
I don't think that data is from identical populations. In the first case, you're getting a histogram of all Garmn bike-ride recorders (and likely mostly watch users). In the second case, you're getting a histogram of only those who can record power, surely a vastly smaller population.
Garmin Connect says my average speed is 78th percentile, but max average power is only 50th percentile.
Speed is a useless measure, as it's dependent on terrain, wind, road surface, aerodynamics, etc.
But what is "max average power"? According to Garmin, it's the highest power recorded over a 20-minute or 60-minute segment. And it records as zero power any time you may have been stopped during that segment. I wouldn't trust that number for much of anything.
Training Peaks tell me that my 20-minute power (watts/kg) is 73rd percentile, my 60-minute power is 84th percentile, and my 90-minute power is 86th percentile. That seems about right (20-minute power probably is low because I'm not doing any 20-minute FTP efforts).
Training Peaks also says that my watts are about the 40th percentile. Which explains why the big guys can destroy me on a flat course.
Speed is a useless measure, as it's dependent on terrain, wind, road surface, aerodynamics, etc.
But what is "max average power"? According to Garmin, it's the highest power recorded over a 20-minute or 60-minute segment. And it records as zero power any time you may have been stopped during that segment. I wouldn't trust that number for much of anything.
Training Peaks tell me that my 20-minute power (watts/kg) is 73rd percentile, my 60-minute power is 84th percentile, and my 90-minute power is 86th percentile. That seems about right (20-minute power probably is low because I'm not doing any 20-minute FTP efforts).
Training Peaks also says that my watts are about the 40th percentile. Which explains why the big guys can destroy me on a flat course.
Appreciate the discussion, All!
11-09-23, 10:12 PM
#8
just another gosling
Join Date: Feb 2007
Location: Everett, WA
Posts: 19,768
Bikes: CoMo Speedster 2003, Trek 5200, CAAD 9, Fred 2004
Liked 2,102 Times
in
1,488 Posts
I pretty much only ride roads/routes which average about 50'/mi. in total gain. So like 60 miles, 3000'. That has a big influence on average speed. Weight to power is a big deal too, as you realize. Anymore, I mostly ride outside on a tandem with my wife. We're geezers, I have a heart condition and neither of us put out a whole lot of watts. However, our tandem confers a significant aero advantage over a single. So last Sunday we did about 30 miles and 1500'. On the flat we were hitting 16-17 mph but our overall average was only 12.4. That's rather an extreme example but it shows what the issues are. IOW never compare your average speed with another's unless you were both riding the same route on the same day.
Back in the day, in my late 50s, early 60s, my fastest average with my single on a typical 60 mile hilly route was 18. Of course there's always That Guy. Our group had a strong rider who'd come out with us and drop any of us on a hill pulling his Golden Retriever in a trailer. Really. He rode with us because we'd ride in any weather every single sucking Sunday and the dog made it good exercise for him. He was a lot of fun to ride with. Went on to be the fastest American on RAAM a few years ago.
Yeah, no data here, just perspective. I do have a PM and record everything though. Not that it makes any difference.
__________________
Results matter
Results matter
11-09-23, 10:50 PM
#9
Senior Member

Join Date: Mar 2023
Location: NorCal
Posts: 825
Bikes: Santa Cruz Blur 4 TR, Canyon Endurace cf sl, Canyon Ultimate cf slx, Canyon Strive enduro, Canyon Grizl sl8
Liked 1,564 Times
in
576 Posts
This. I have the inverse of the OP...according to Garmin Insights, I have a "max avg power" in the 94th percentile. However, my speed is only in the 51st. I live/ride in the mountains, it's a rare occurrence that I do a ride that falls below the golden ratio of 100'/mile.
11-12-23, 09:04 AM
#10

Version 7.0

I have a Garmin 830 and do not get Insights from my Garmin app.
Speed versus power. I am a data junkie that records most every metric and I have done detailed aero testing at the indoor velodrome using a third party service.
Since this is a training subform and many want to increase performance - speed matters...a lot. Power is ones currency to buy speed and of course there is a cost. The cost is a function of ones weight, frontal area, tires, wheels, bike, helmet and position. Much like in finance, if one has enough money, one can buy whatever one wants and even overpay for it.
In the world of cycling performance, power, our currency to buy speed seems to always be in snort supply. The cyclist that can generate the most speed at the right moment wins. And I seem to top out at speed for different events whether I am sprinting, climbing or doing a time trial. Of course terrain, wind and road surface affects speed but it does for all players.
At our structured track sessions, we divide into two groups - fast and less fast. It is all about lap times - speed. To ride with the fast group, one has to be able to do 18 second laps or 31mph for solo efforts and recover. Sometimes, we have a motor that runs at 19 seconds per lap and the group must take laps on the motor. I see all kinds riders in different positions, equipment and body morphology. If ones cost of speed is too high, it is very tough to continuously make enough power to buy that kind of speed.
In the less fast group, the problem is the same. If the cost of speed is too high, one quickly runs out of energy and power generating capability.
Having said all that, I get why some will focus on FTP and power as a measure of capability and fitness. It is a solid metric for general fitness and a predictor of performance. But when training and racing with some of the best cyclists in world, power is not enough.
11-12-23, 10:10 AM
#11
Perceptual Dullard
Speaking of Garmins, I think Garmins have pretty much accepted showing power metrics; what they still don't do very well is show drag metrics. I think that'd be a good next step.
11-12-23, 04:53 PM
#12
Senior Member
Join Date: Jan 2023
Location: Eastern Shore MD
Posts: 1,207
Bikes: Lemond Zurich/Trek ALR/Giant TCX/Sette CX1
Liked 1,128 Times
in
560 Posts
I don’t have that function on my app for some reason…
But from Strava segment data and riding with others, I put out more power than others at similar speeds.
Im slower than the bike calculator website predicts, I’m slower than my zwift speeds… 180w on zwift gets me 20-21 MPH, I get about 19 on dead flat roads.
I recently did a dead flat Strava segment at 285w, decent 8-10 MPH tailwind and only managed around 24 MPH. About 3 mph slow…
On top of body aerodynamics, wheels and tires can affect this data. Upgrading to CF deep wheels and GP5000’s gave me over 1 mph extra over the crap stock stuff that came with my bike.
11-12-23, 06:35 PM
#13
I wonder if anyone can match their Zwift speeds on the flat? Those Zwift roads are super quick! My Zwift climbing speeds are realistic, but not on the flat. My flat cruising speed on Zwift is around 36-38 kph and more like 33 kph outdoors. My local roads are pretty rough though in fairness.
11-12-23, 09:19 PM
#14
I don’t have that function on my app for some reason…
But from Strava segment data and riding with others, I put out more power than others at similar speeds.
Im slower than the bike calculator website predicts, I’m slower than my zwift speeds… 180w on zwift gets me 20-21 MPH, I get about 19 on dead flat roads.
I recently did a dead flat Strava segment at 285w, decent 8-10 MPH tailwind and only managed around 24 MPH. About 3 mph slow…
On top of body aerodynamics, wheels and tires can affect this data. Upgrading to CF deep wheels and GP5000’s gave me over 1 mph extra over the crap stock stuff that came with my bike.
But from Strava segment data and riding with others, I put out more power than others at similar speeds.
Im slower than the bike calculator website predicts, I’m slower than my zwift speeds… 180w on zwift gets me 20-21 MPH, I get about 19 on dead flat roads.
I recently did a dead flat Strava segment at 285w, decent 8-10 MPH tailwind and only managed around 24 MPH. About 3 mph slow…
On top of body aerodynamics, wheels and tires can affect this data. Upgrading to CF deep wheels and GP5000’s gave me over 1 mph extra over the crap stock stuff that came with my bike.
With an additional 125 watts at my disposal, I’d likely be averaging 26-27 mph with a similar tailwind…I suspect.
11-13-23, 05:30 AM
#15
Senior Member
Join Date: Jan 2023
Location: Eastern Shore MD
Posts: 1,207
Bikes: Lemond Zurich/Trek ALR/Giant TCX/Sette CX1
Liked 1,128 Times
in
560 Posts
I wonder if anyone can match their Zwift speeds on the flat? Those Zwift roads are super quick! My Zwift climbing speeds are realistic, but not on the flat. My flat cruising speed on Zwift is around 36-38 kph and more like 33 kph outdoors. My local roads are pretty rough though in fairness.
The canal path is a fast surface. I'm about as aero as a brick... working on that this winter.
I like the "cost of speed" analogies made by Hermes.
11-13-23, 05:45 AM
#16
Senior Member
Join Date: Jan 2023
Location: Eastern Shore MD
Posts: 1,207
Bikes: Lemond Zurich/Trek ALR/Giant TCX/Sette CX1
Liked 1,128 Times
in
560 Posts
19:15, 20.3 MPH @ 209w
13:28, 19.8 @ 203w
Bike calculator example of the same conditions with a 5 mph tailwind = 24.19 MPH.
KOM for the segment is 27.1 MPH at 213w. Probably a wicked tailwind and a TT bike - but I've hammered the segment at 250+ with a tailwind and come nowhere close to that speed.
Some people are simply more efficient than others.
Last edited by Jughed; 11-13-23 at 05:48 AM.
11-13-23, 08:13 AM
#17
Perceptual Dullard
If only there were some Garmin data field that would tell you how much of a brick you are.
Likes For RChung:
11-13-23, 08:39 AM
#18
Version 7.0
jughead The low hanging / less expensive fruit to lower the cost of speed are clothes, helmet, head position (free) and tires/tubes. In the aero testing sessions, if one has their head up in the air, one is dead on arrival with respect to drag. Even if one puts a million dollar helmet on ones head, if the head is up and in the air versus turtled or down, it is hard to get a low cost of speed. And it takes a lot of practice and constant reminder to keep ones head down. The best way to know if the head is down is how one sees ahead. If one is looking up and through ones eyebrows, then the head is probably in a good position. And of course, never sacrifice looking ahead for road hazards.
On the indoor track, I generate 20 mph at 160 watts and that is not in the aerobars. Outdoors on a flat TT course on the road bike it is more like 175 to 180 that is probably right around VT 1 for me (on a good day).
On the indoor track, I generate 20 mph at 160 watts and that is not in the aerobars. Outdoors on a flat TT course on the road bike it is more like 175 to 180 that is probably right around VT 1 for me (on a good day).
Likes For Hermes:
11-13-23, 05:28 PM
#19
climber has-been
Join Date: Dec 2004
Location: Palo Alto, CA
Posts: 7,525
Bikes: Scott Addict R1, Felt Z1
Liked 4,064 Times
in
2,003 Posts
No idea if that tracks for anyone else.
__________________
Ride, Rest, Repeat. ROUVY: terrymorse
Ride, Rest, Repeat. ROUVY: terrymorse
11-13-23, 05:41 PM
#20
Perceptual Dullard
Likes For RChung:
11-14-23, 05:52 AM
#21
Senior Member
Join Date: Jan 2023
Location: Eastern Shore MD
Posts: 1,207
Bikes: Lemond Zurich/Trek ALR/Giant TCX/Sette CX1
Liked 1,128 Times
in
560 Posts
On today's ride, there was one pancake flat and straight section, so I tried to keep my power right at 200 watts (3.33 w/kg). My speed over that segment was just under 22 mph. I'm a 181 cm skinny guy on a non-aero bike, no aero anything, hands on hoods with forearms parallel to ground.
No idea if that tracks for anyone else.
No idea if that tracks for anyone else.
I'm +/- 2 MPH slower at the same power levels.
A 20mph rolling average ride for me = 230-240w.
I just purchased a bike with more aggressive geometry and am working on my position - shall see how much of a difference I notice over time.
11-19-23, 08:55 PM
#22
The MyWindsock app is supposed to give you some calculated coefficient of drag (CdA); however, you have to pay for the premium version of the app. It sounds like you might be able to make aero improvements to your setup and see those calculated in the app’s estimate. I wouldn’t have high hopes for its accuracy.
11-20-23, 10:17 AM
#23
Perceptual Dullard
The MyWindsock app is supposed to give you some calculated coefficient of drag (CdA); however, you have to pay for the premium version of the app. It sounds like you might be able to make aero improvements to your setup and see those calculated in the app’s estimate. I wouldn’t have high hopes for its accuracy.
Likes For RChung:
11-29-23, 03:05 PM
#24
Newbie racer
Raw power wise, it may skew high on a large population due to the large population skewing well...........larger, in the waist.
Otherwise, speed is fun, but meh. Lots of variables. I ride a lot of gravel lately so the avg speed is well down from road riding. Even my road riding, lots of short 8% hills in/around town to get out to the flatter riding. And in town several stops and very slow turns or stops at the bottom of hills you wish you could keep your momentum thru.
Ever want to feel "small". Do some running and lookup you percentiles in Garmin. You think your 7:00/mile 5k workout is swift..........then you realize......dang slow!
